User Guide
For anyone who uses Silver Bullet 3: how to ask questions, read and change the answers, correct a wrong one, keep what you find on saved answers, boards and briefs, take it out as a download, and see what was sent to the AI model. Starting Silver Bullet is in Getting Started; adding data sources and the data dictionary are in the Administration Guide.
You do not need to know SQL, table names or column names. You need to know your business.
This guide is also inside Silver Bullet: ? in the top bar (or Help in your menu) opens every guide in a new tab, with a search box, and needs no internet.
Silver Bullet runs on your own computer, for you alone, so every button in this guide is yours: there are no other people, roles or permissions to think about.
The first time you start it, and again whenever one of them changes, Silver Bullet shows the End User Licence Agreement, the Terms of Service and the Privacy Notice on a Before you start page. Tick the box and choose Agree and continue to use it. About Silver Bullet (in your account menu) links to all three and shows the date you agreed.
What happens when you ask
- Silver Bullet reads your question with the words of your data: the figures it can add up (net sales, units), the groupings (region, product, customer), the dates, and the business words you taught it in the data dictionary. A question you tap or build is understood completely this way, at once.
- When it cannot read a typed question on its own, it asks the AI model for help. The model sees your question and the names of tables and columns, never your rows.
- It writes one read-only query, checks it, and runs it on the data source.
- It shows the answer as a sentence, a chart and a table, and tells you exactly how it read your question, so you can change any part with a tap.
Three things to keep in mind:
- It only reads. A question that asks to change data (“delete the cancelled orders”, “increase the price by 5%”) is refused before anything is asked of the data.
- Answers are worked out on the latest data you have. A database is read as it is now; a file as it was when it was last loaded.
- Check before it leaves the building. Read the chips and How I got this for any figure that goes into a board pack, a target or a filing.
The home page
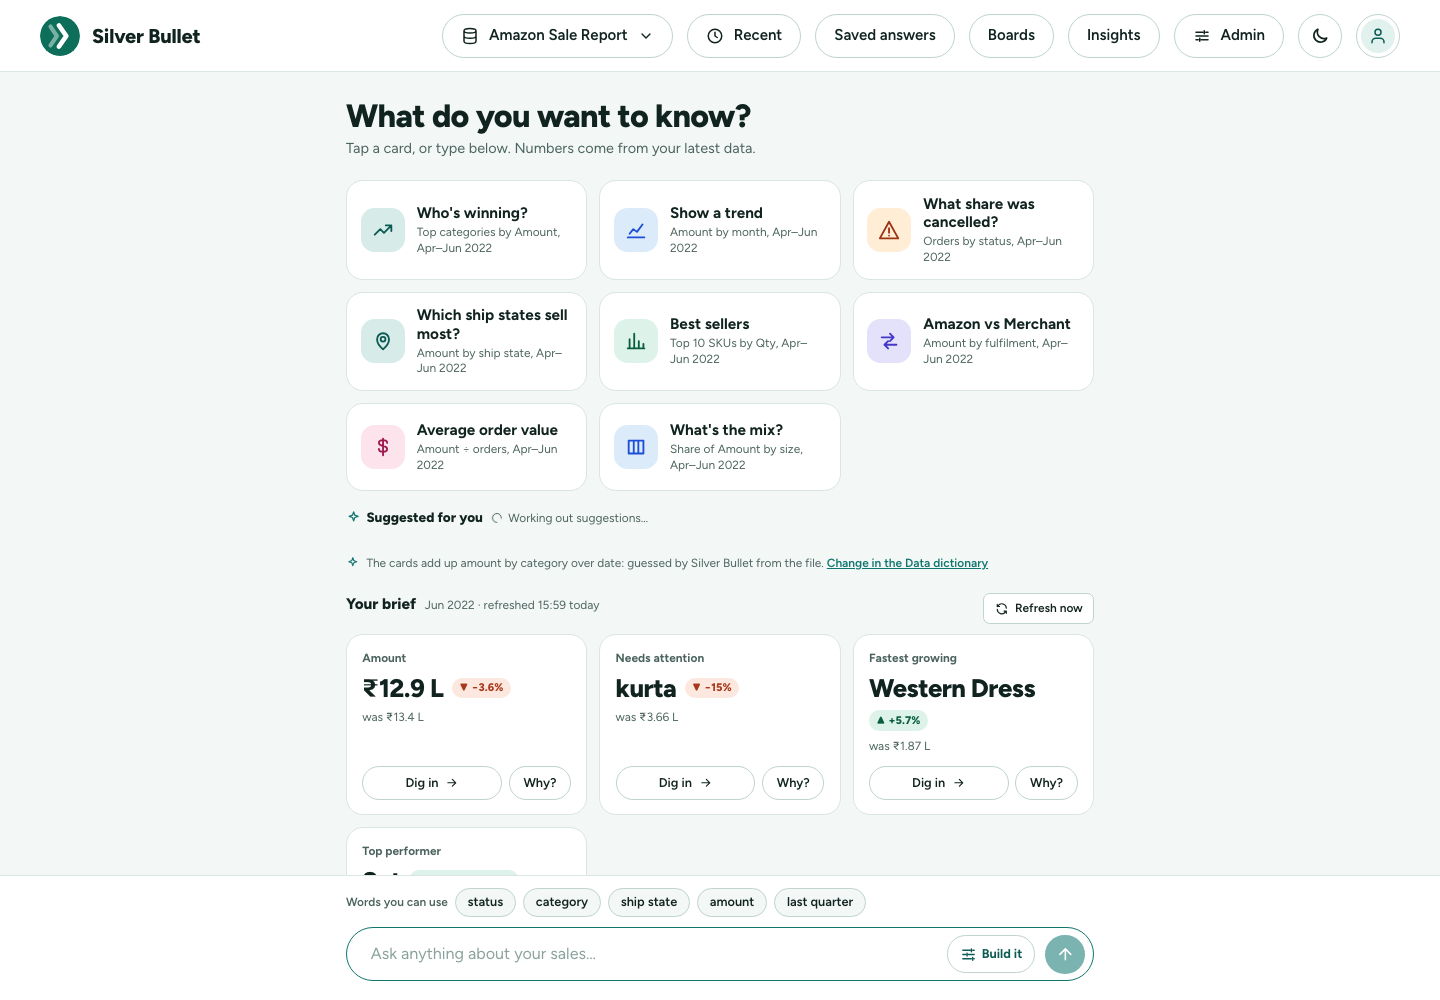
The cards
What do you want to know? offers six to eight questions you can ask with one tap. Silver Bullet chooses them by what your data’s columns are, and words them with your data’s own names and dates. A marketplace order report, for example, gets:
| Card | Asks |
|---|---|
| Who’s winning? (Top categories by Amount, Apr–Jun 2022) | the top five of the main grouping |
| Show a trend (Amount by month, Apr–Jun 2022) | the main figure month by month |
| What share was cancelled? (Orders by status, Apr–Jun 2022) | the share of orders in each status |
| Which ship states sell most? (Amount by ship state, Apr–Jun 2022) | the top ten places |
| Best sellers (Top 10 SKUs by Qty, Apr–Jun 2022) | the products that sold most |
| Amazon vs Merchant (Amount by fulfilment, Apr–Jun 2022) | the two ways of selling side by side |
| Average order value (Amount ÷ orders, Apr–Jun 2022) | the total divided by the number of orders |
| What’s the mix? (Share of Amount by size, Apr–Jun 2022) | the share of each size |
An export register with customers, SKUs, sizes, pieces and a rate gets Top 10 customers, Average price per unit (Gross amount ÷ Pcs) and so on; a list of invoices with due dates gets What’s overdue?; a file with only a category and a number gets Who’s winning?, What’s the mix? and Look up one number. A card is shown only if its question fits your data and its answer has figures, so you never tap a card and get No data. The periods are your data’s own: data that ended in June 2022 gets Apr–Jun 2022, not an empty “last quarter” of today.
Hold the pointer over a card to see the exact question it asks. On All my data the best cards of all your sources are shown, each with its source’s name under it.
The cards are worked out when your data changes (a file loaded or replaced, the data dictionary published, a database on its schedule) and kept, so the home page opens at once. Just after you add a file, the cards appear a few seconds later (Working out the cards for your data…).
Suggested for you
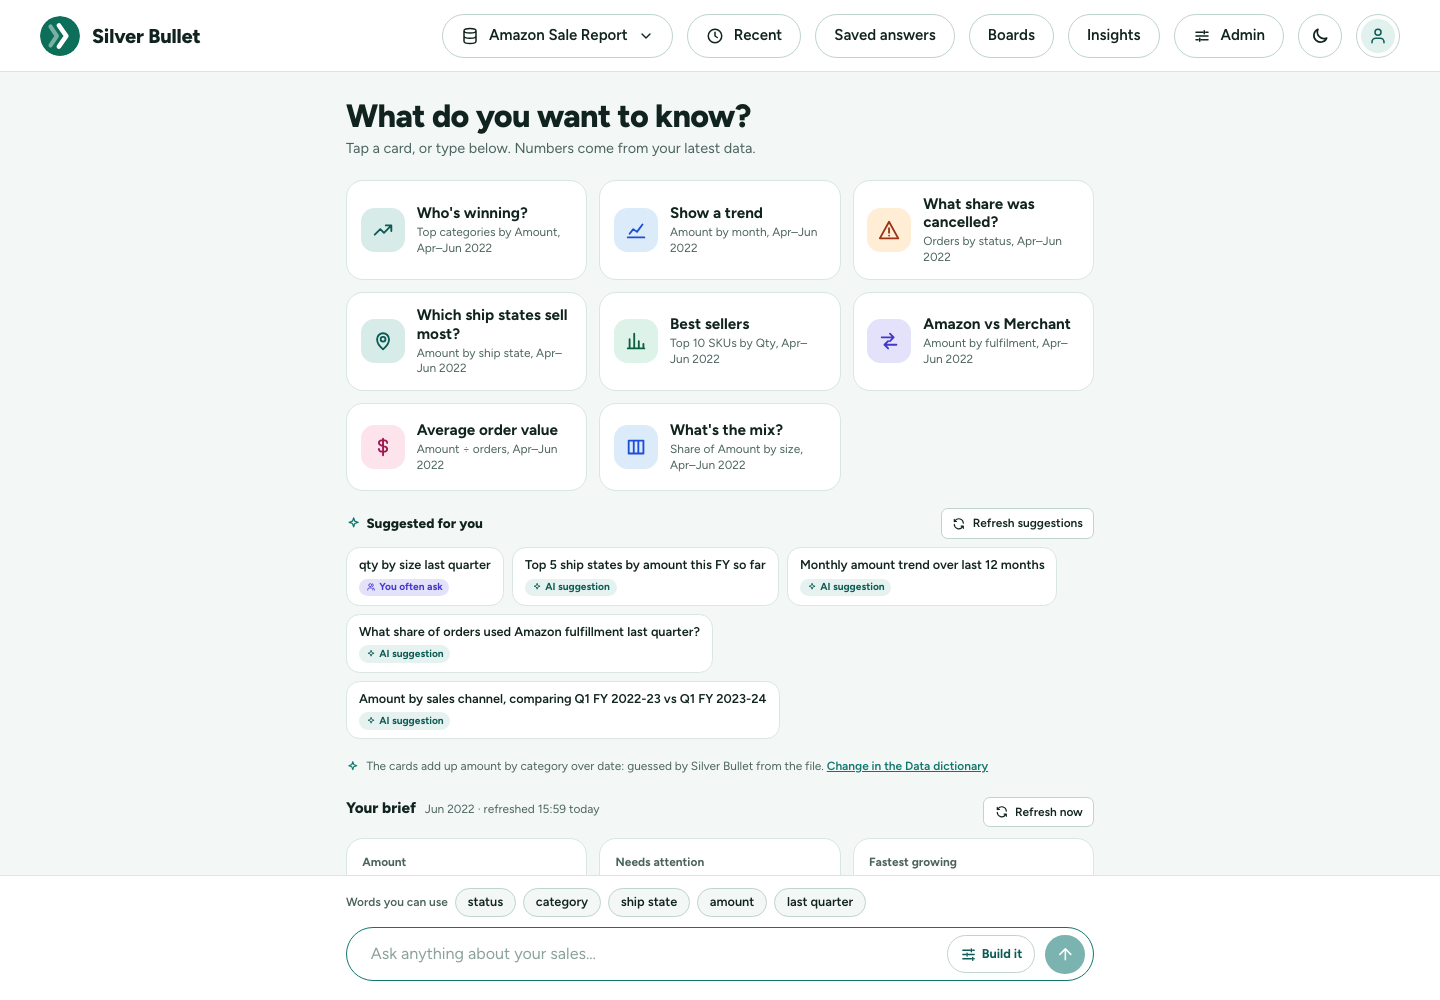
Under the cards, Suggested for you offers more questions, each with a small tag that says where it came from:
- You often ask: questions you asked, tapped or saved at least three times on this data in the last 90 days, counted once however they were worded. A question whose answer you marked wrong, or a correction you have not checked yet, is never offered.
- AI suggestion: when an AI model is set up, it suggests questions people in your business would ask of this data, in their own words. Silver Bullet reads each one into choices and keeps it only if it fits and its answer has figures, so these answer too.
Tap one to ask it. You often ask needs no AI model. When the model is slow or not running, the row simply shows what you often ask (or nothing), and the rest of the home page is not held up.
Your brief
Your brief is a few cards worked out in advance, so the home page opens instantly: for example the total of your main figure, what Needs attention, and the Top performer. Each card shows the figure, the change against the period before (green up, red down) and what it was.
- Dig in opens the full answer behind the card.
- Why? (when the figure moved) asks what changed it.
Beside the title you see the period the brief covers (for example Q4 FY 2025-26 (Jan–Mar 2026)) and when it was refreshed. The brief is worked out again on each source’s schedule: for a database, at 6:00 every morning unless you chose another time under Health and logs; for a file, whenever the file is loaded or replaced. Until a data source has been read, the brief says Your brief appears here once your data has been read.
Refresh now, beside the title, works the brief out again at once from the latest data: for the data picked in the data picker, or every source for All my data.
The data picker
The button at the top left of the bar chooses which data you ask about:
- All my data: every data source you have added and switched on. For each question Silver Bullet picks the source whose words fit it best; the first chip of the answer says which one it used. With more than one source, the brief names the source of each card.
- One source, by name: every question goes to that source only.
Silver Bullet remembers your choice in this browser. One question is answered from one source: combining two sources in one question is not in this release.
The ask box and “Words you can use”
At the foot of the page is the ask box, Ask anything about your sales…. Above it, Words you can use shows a few words your data understands (groupings, the main figure, last quarter); tap one to add it to the box.
Four ways to ask
Every way below sends the same kind of request, and every answer looks the same. Use whichever is quickest for you.
1. Tap
- A home card or a brief card’s Dig in / Why?.
- An Ask next chip under any answer (see Ask next).
- A column chip in a conversation. Above the ask box, Tap a column name to add it to your question lists the columns of the data, each with a badge: ABC for text, DATE for dates, 123 for numbers. Hold the pointer over one to see sample values. +N more shows the rest. Tapping a chip adds its name to what you are typing.
Tapped questions are answered without the AI model and come back quickly.
2. Build it
Press Build it in the ask box to make a question from words, with no typing. Pick what you want to do, then fill in the sentence.
I want to…
| Pick | The sentence | You get |
|---|---|---|
| Total | Show the total net sales split by region | bars, or one number |
| Average | Show the average rating split by category | bars, or one number |
| Count | Show the number of rows (or different customers) split by region | bars, or one number |
| Top | Top 10 products by total net sales | the largest few |
| Bottom | Bottom 5 products by total net sales | the smallest few |
| List rows | List product, region, net sales … sorted by net sales, highest first (20 rows) | a table of the rows |
| Share | Share of net sales by region | each part’s share of the whole |
| Trend | Show the total net sales by month | a line over time |
| Compare | Show the total net sales during FY 2025-26 against the period before | the two side by side |
The number can be added up as a total, an average, the highest or the lowest single value. A price, rate, percentage, rating or score starts as the average, and anything else as the total. A total of prices means nothing.
Others in a Top or Bottom answer. When the figure is a total or a number of rows, a Top or Bottom answer ends with one more bar and one more table row, Others: everything outside the top (or bottom) few, added up. The bars then add up to the whole, and the table’s Total is the total of everything, not only of the few shown. Others is always last, whatever its size, and always in grey: the headline is never about it. There is no Others when nothing is left outside the few, or when the rest adds up to zero. An average, a highest or lowest value, or a number of different values has no Others: the average of “everything else” would mislead, so those answers show only the few you asked for.
Where… adds up to three conditions, for example region is North, rating is at least 4.5, net sales is between 1,000 and 50,000, order date is on or after 1 Jan 2026, or product contains tea. A text column suggests its values as you type. A number or a date is typed.
During… limits the answer to a period: the last 7, 30 or 90 days, this or last month or quarter, the last 3, 6 or 12 months, this financial year so far, last financial year, a calendar year, or one of the financial years and quarters your data covers. Periods your data does not reach are greyed out. If the data has no dates, there is no period to choose, and Trend and Compare are greyed out.
Start from: when Build it opens, it suggests up to five questions made from your data. Tap one to fill in the sentence, then change any word.
The sentence you are building shows underneath. Show me the answer stays greyed out until the sentence is complete, and says what is missing. A column with a value for nearly every row (an ID, a product name) is greyed out under split by; use Top or List rows for it.
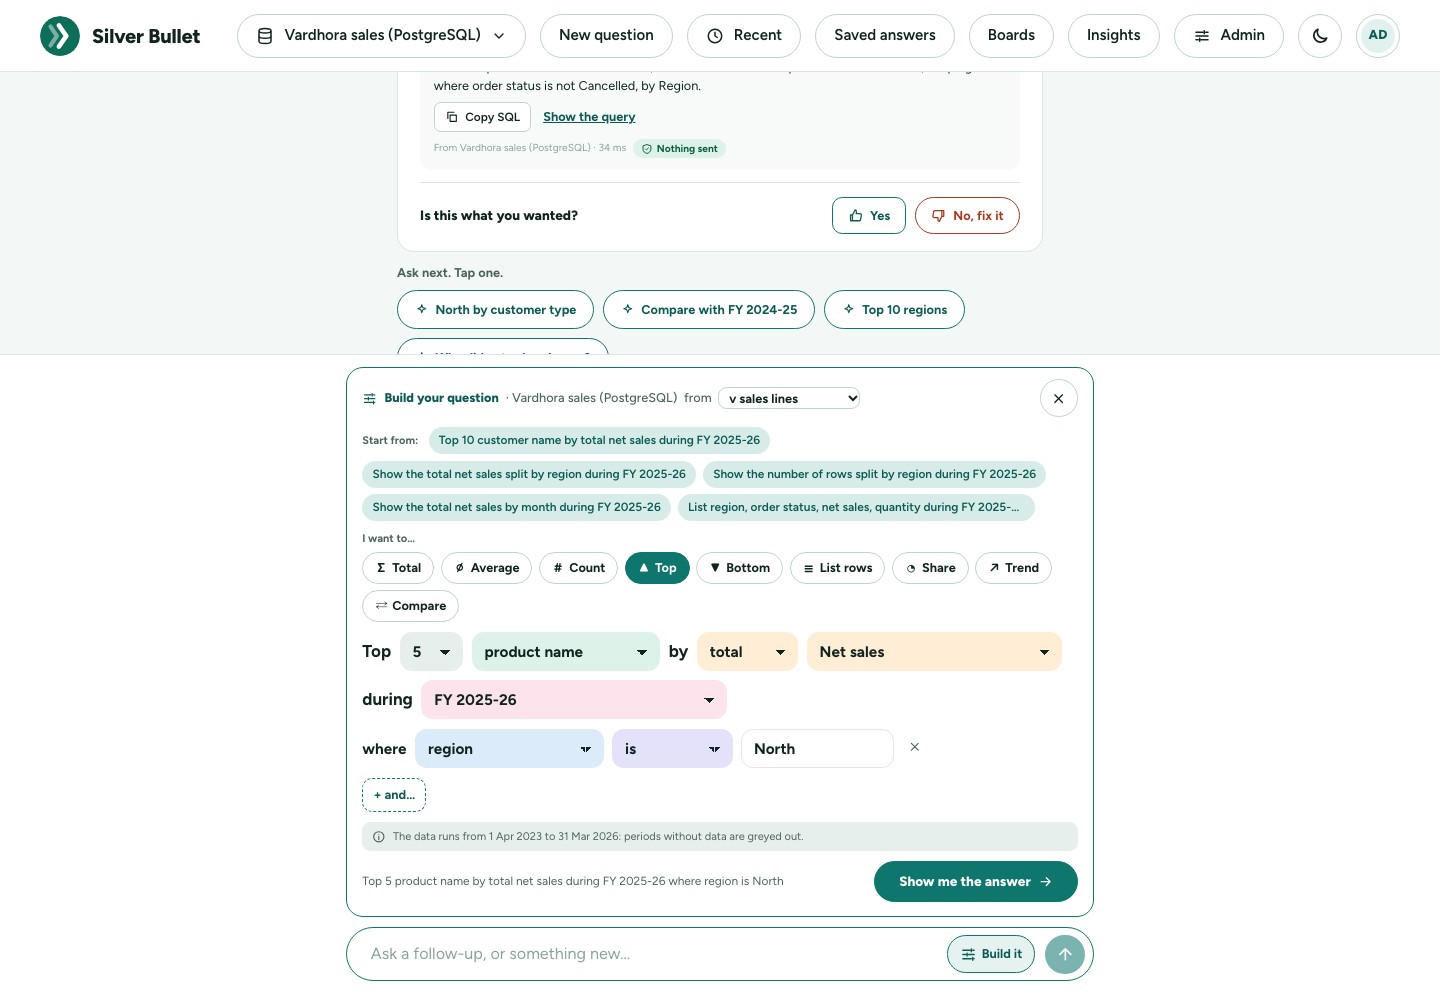
Edit in builder. Under any answer, Edit in builder opens its question in Build it, word by word, so you can change one word and ask again. Your administrator’s rules (such as leaving out cancelled orders) apply by themselves and are not shown as your conditions.
A built question never waits for the AI model: it is answered straight from your data. If the data has nothing to ask about yet, Build it says so.
3. Type, with type-ahead
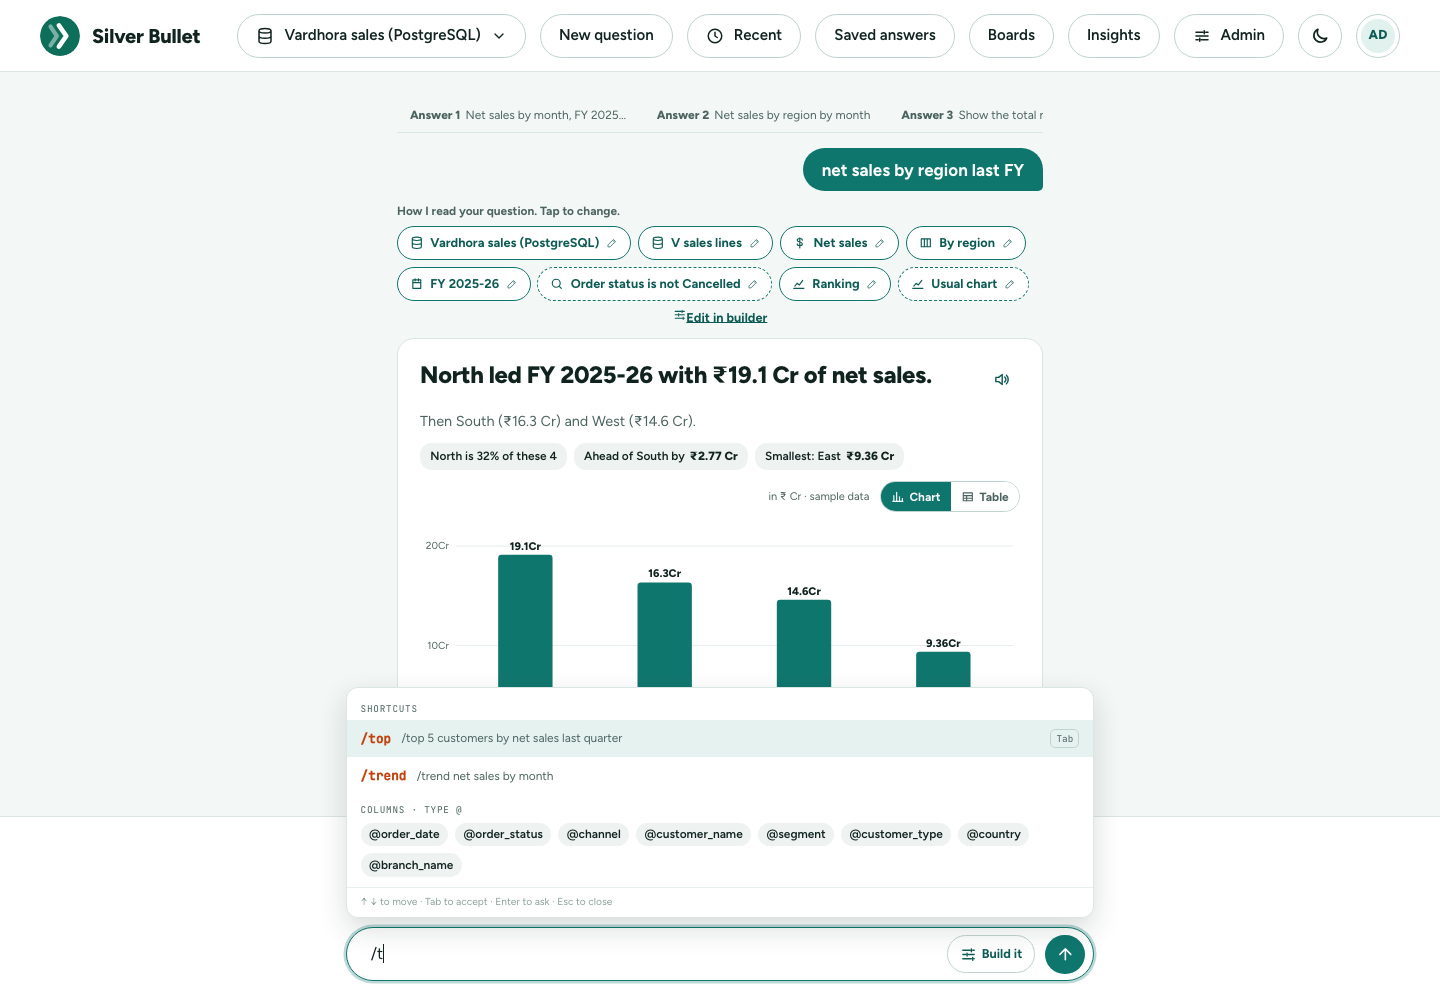
Type in the ask box and press Enter (or the arrow). As you type, Silver Bullet suggests:
- Columns matching what you typed, with their badge and sample values;
- Ready-made questions that contain your word.
↑ ↓ move through the suggestions, Tab accepts one, Enter asks, Esc closes the list (a second Esc clears the box).
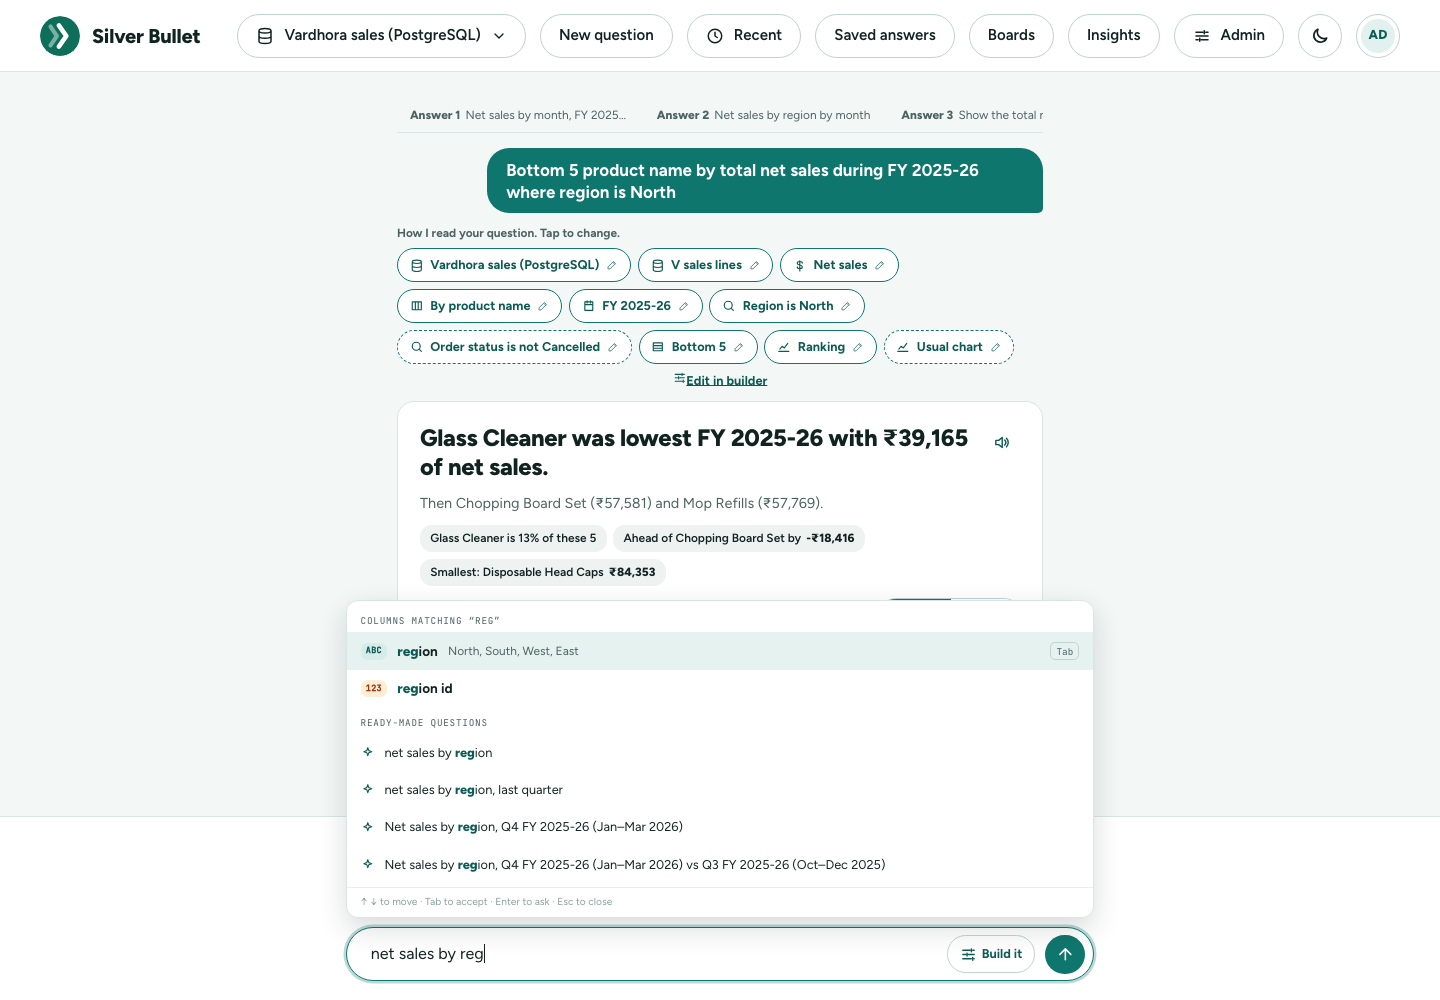
A typed question that Silver Bullet cannot read on its own goes to the AI model, and can take 15 to 30 seconds with a local model (the page says so while you wait). A question it can read by itself is as quick as a tap.
4. Shortcuts and @columns
Start a question with a /shortcut to say what kind of answer you want. Type / to see the list:
| Shortcut | What it gives | Example |
|---|---|---|
| /top | a ranking, highest first (5 unless you give a number) | /top 5 customers by net sales last quarter |
| /bottom | a ranking, lowest first | /bottom 5 products by units this FY |
| /trend | a trend over time | /trend net sales by month |
| /compare | a comparison of two periods | /compare net sales FY 2024-25 vs FY 2023-24 |
| /share | each part’s share of the total | /share net sales by region |
| /list | a list of rows | /list @customer_name @city |
A shortcut works only as the first word. /top 10 … sets the number.
Type @ to name a column exactly as it is in the data: @region,
@customer_name. The list under Columns · type @ shows what you can
use. Names with spaces go in quotes or square brackets: @"customer name", @[customer name].
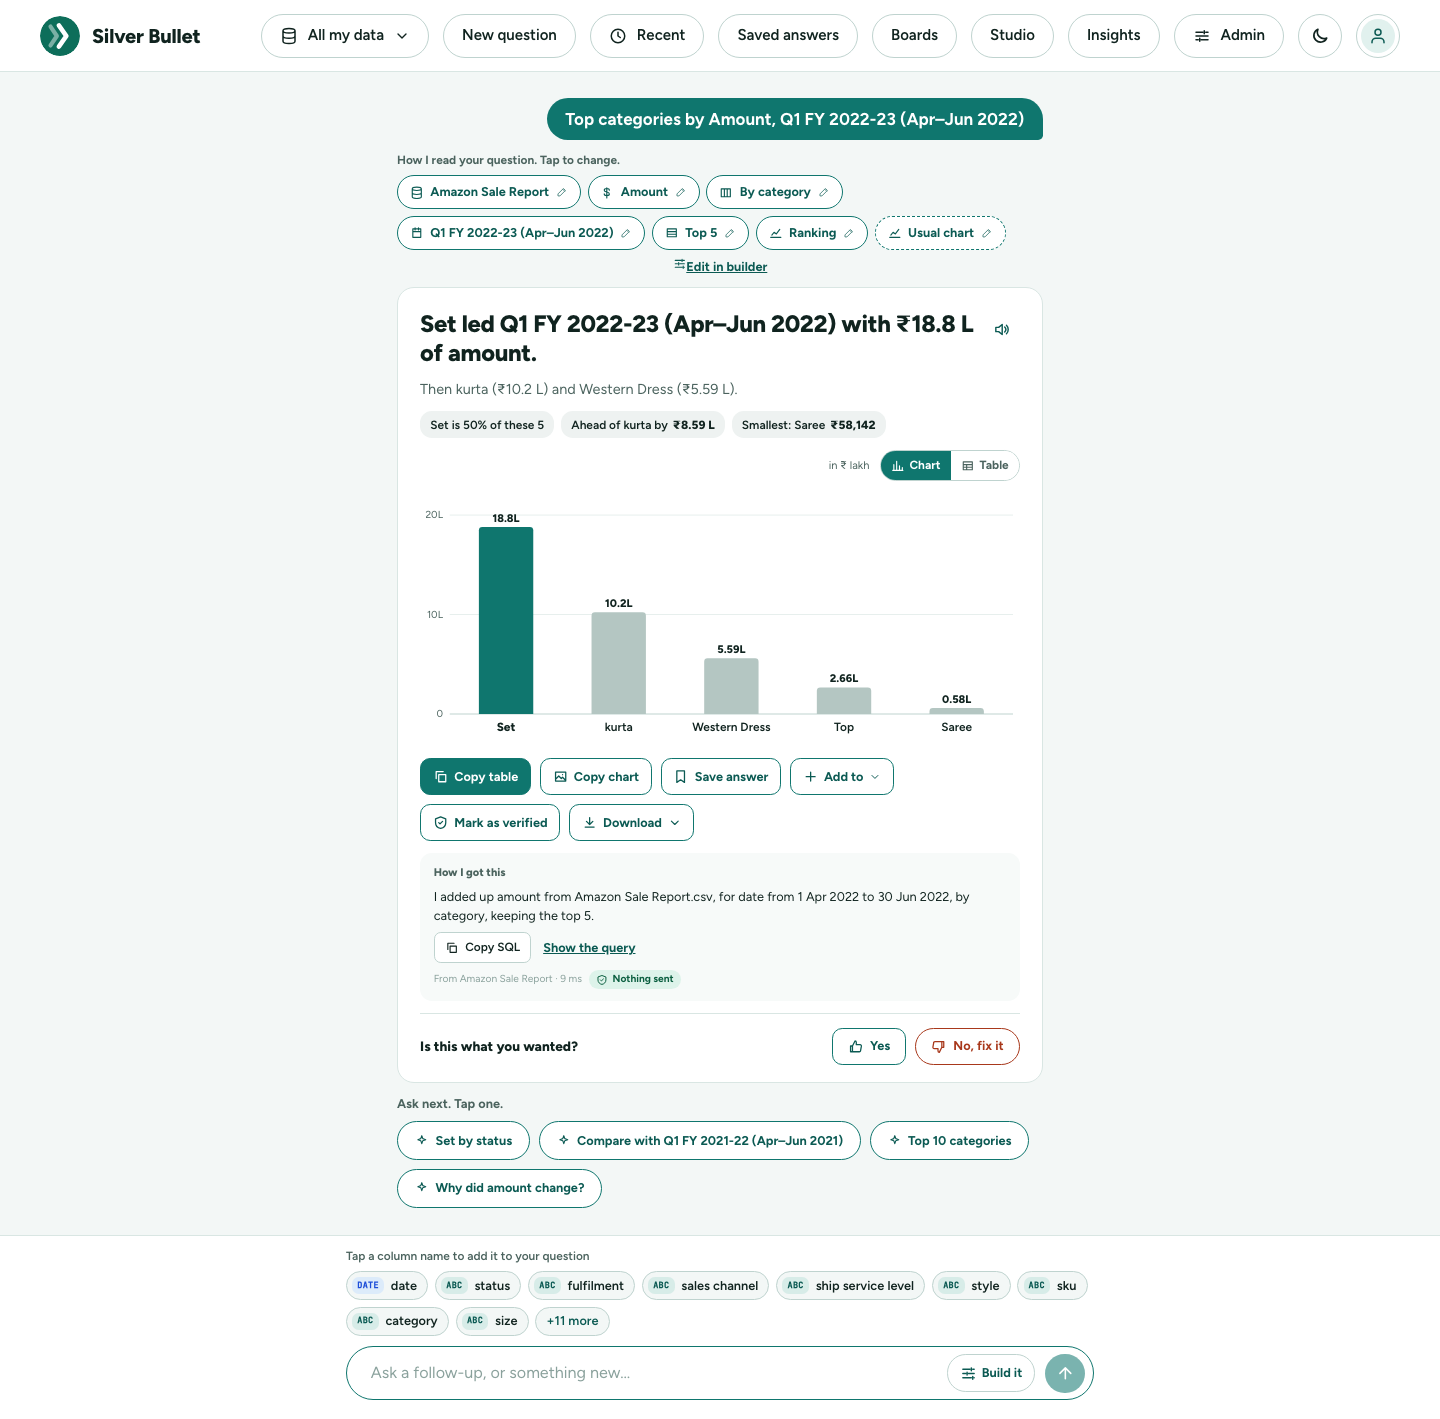
The answer card
How I read your question
At the top, How I read your question. Tap to change. shows each part of how your question was understood, as a chip: the data source and table, the figure (for example Net sales), the split (By region), the period (FY 2025-26), any filter (Segment is Caterer), a ranking (Top 5), and the kind of answer (Ranking, Trend over time, What changed, Comparison of two periods, Share of the total, One number).
A chip with a dashed border was not in your words: it comes from a rule in your data dictionary (for example “leave out cancelled orders”) or is the usual choice. Tap any chip to see where it came from: from your words, from the data dictionary, read by the AI model, from a verified answer.
Changing a chip. Tap it, then pick another option:
| Chip | You can change it to |
|---|---|
| Period | another period (this FY so far, a quarter, a month, the last 3 or 12 months, another FY), or All dates |
| Compared with | The period before, Same period last year, or No comparison |
| Figure | another measure or numeric column, and how it is added up |
| Split | By another column, By day, week, month, quarter, financial year or calendar year, or Not split (one number) |
| Filter | Only another value, or Remove this filter |
| Ranking | Top 3, Top 5, Top 10, Top 20, Bottom 5, Bottom 10, or Show all |
| Kind of answer | one number, ranking, trend, comparison, what changed, share |
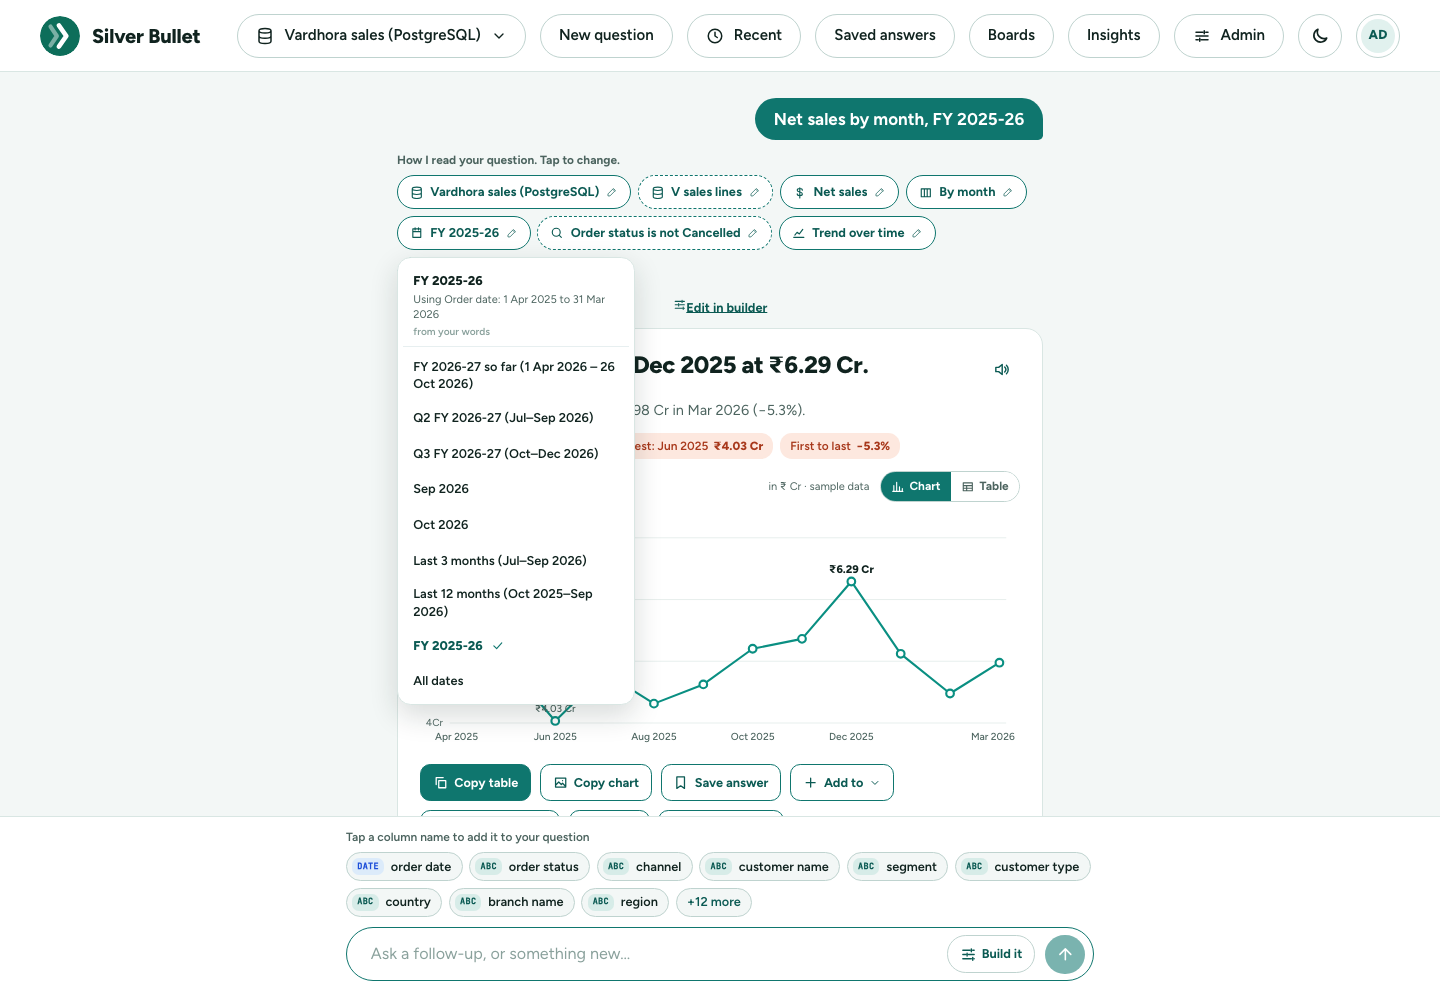
The answer is worked out again straight away, without the AI model: usually in under two seconds, often from the result kept a moment ago. A chip that cannot be changed says This part cannot be changed with a tap. Ask again in other words. An answer worked out by its own query (not the usual choices) says This question needed more than the usual choices, so its parts cannot be changed with a tap.
Headline, supporting line, summary chips
- The headline answers in one sentence: North led FY 2025-26 with ₹19.1 Cr of net sales.
- The supporting line adds the next thing you would ask: Then South (₹16.3 Cr) and West (₹14.6 Cr).
- Summary chips are short findings: the highest and lowest, the leader’s share, the gap to the next, what grew fastest (green) and what fell most (red).
Notes under the actions say anything else you should know, for example that “last year” was read as the financial year.
Please check
When the AI model read your question and something in the answer looks wrong, the answer says so under the headline, in amber: Please check. The AI model read this question, and something in the answer looks wrong: followed by what to look at. For example:
- Your question asks for a calculation (“minus”), but this answer adds up Line amount as it is. The answer is one column added up, not the calculation you described.
- The query combines AND and OR in its WHERE clause without parentheses … The conditions may not be the ones you meant.
- The share came out at exactly 100% … The condition meant to pick out the part matched every row.
- The query compares place of supply with “India”, which is not one of its values … That condition keeps every row (or none).
Look at How I read your question and How I got this. If the answer is wrong, tap No, fix it. These checks look for signs of a wrong answer; an answer without them is not guaranteed right, and an answer with them may still be right.
Charts
Silver Bullet picks the chart from the kind of question:
| Chart | When you see it |
|---|---|
| Bars | a ranking (“net sales by region”, “top 10 customers”) |
| Grouped bars | a ranking split two ways (“net sales by region and channel”) |
| Line | a trend over time (“net sales by month”) |
| Number tiles | one number, or one number in two periods |
| Start-and-end dots | a comparison of two periods, group by group: filled dot now, hollow dot before |
| Waterfall | “what changed”: from the earlier total, each group’s rise or fall, to the new total (Total, Added, Lost) |
| Change bars | “what changed” with more than 12 groups: each group’s change as a bar |
| Share bar | each part’s share of the total, in % |
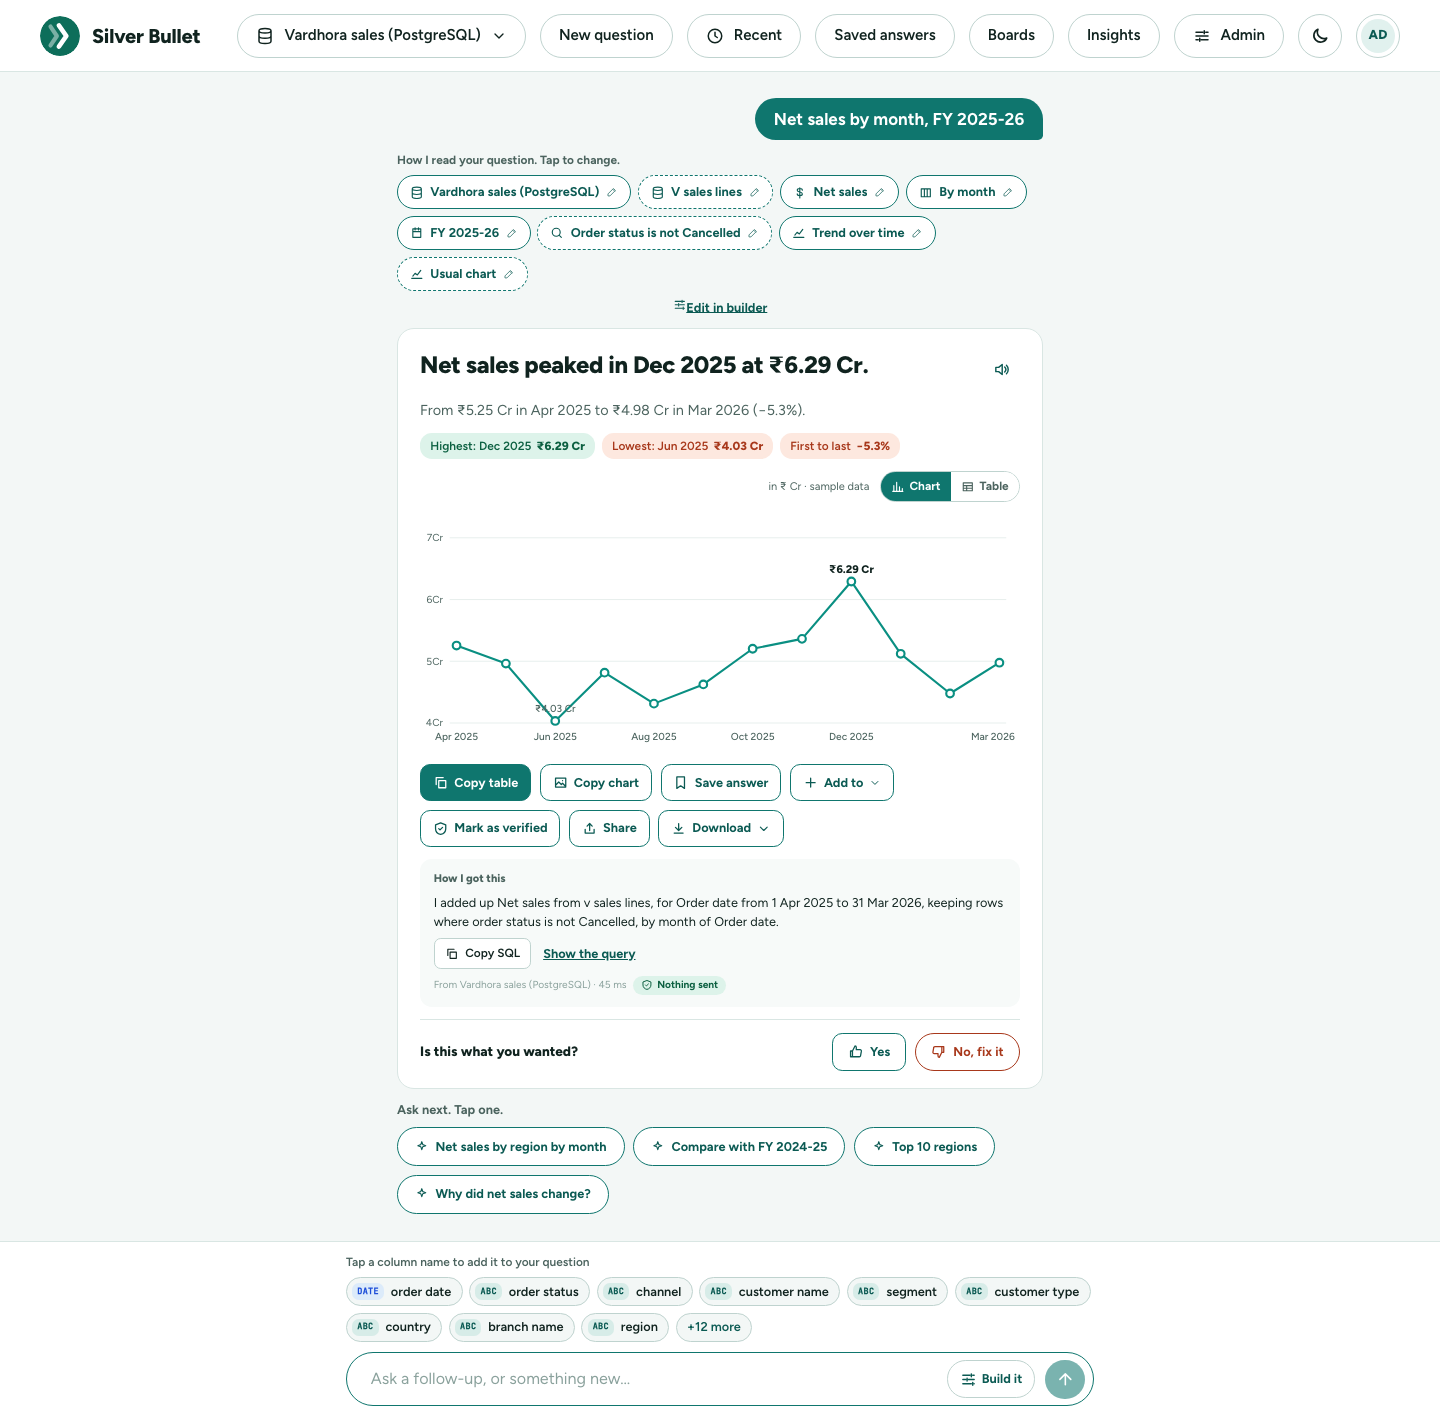
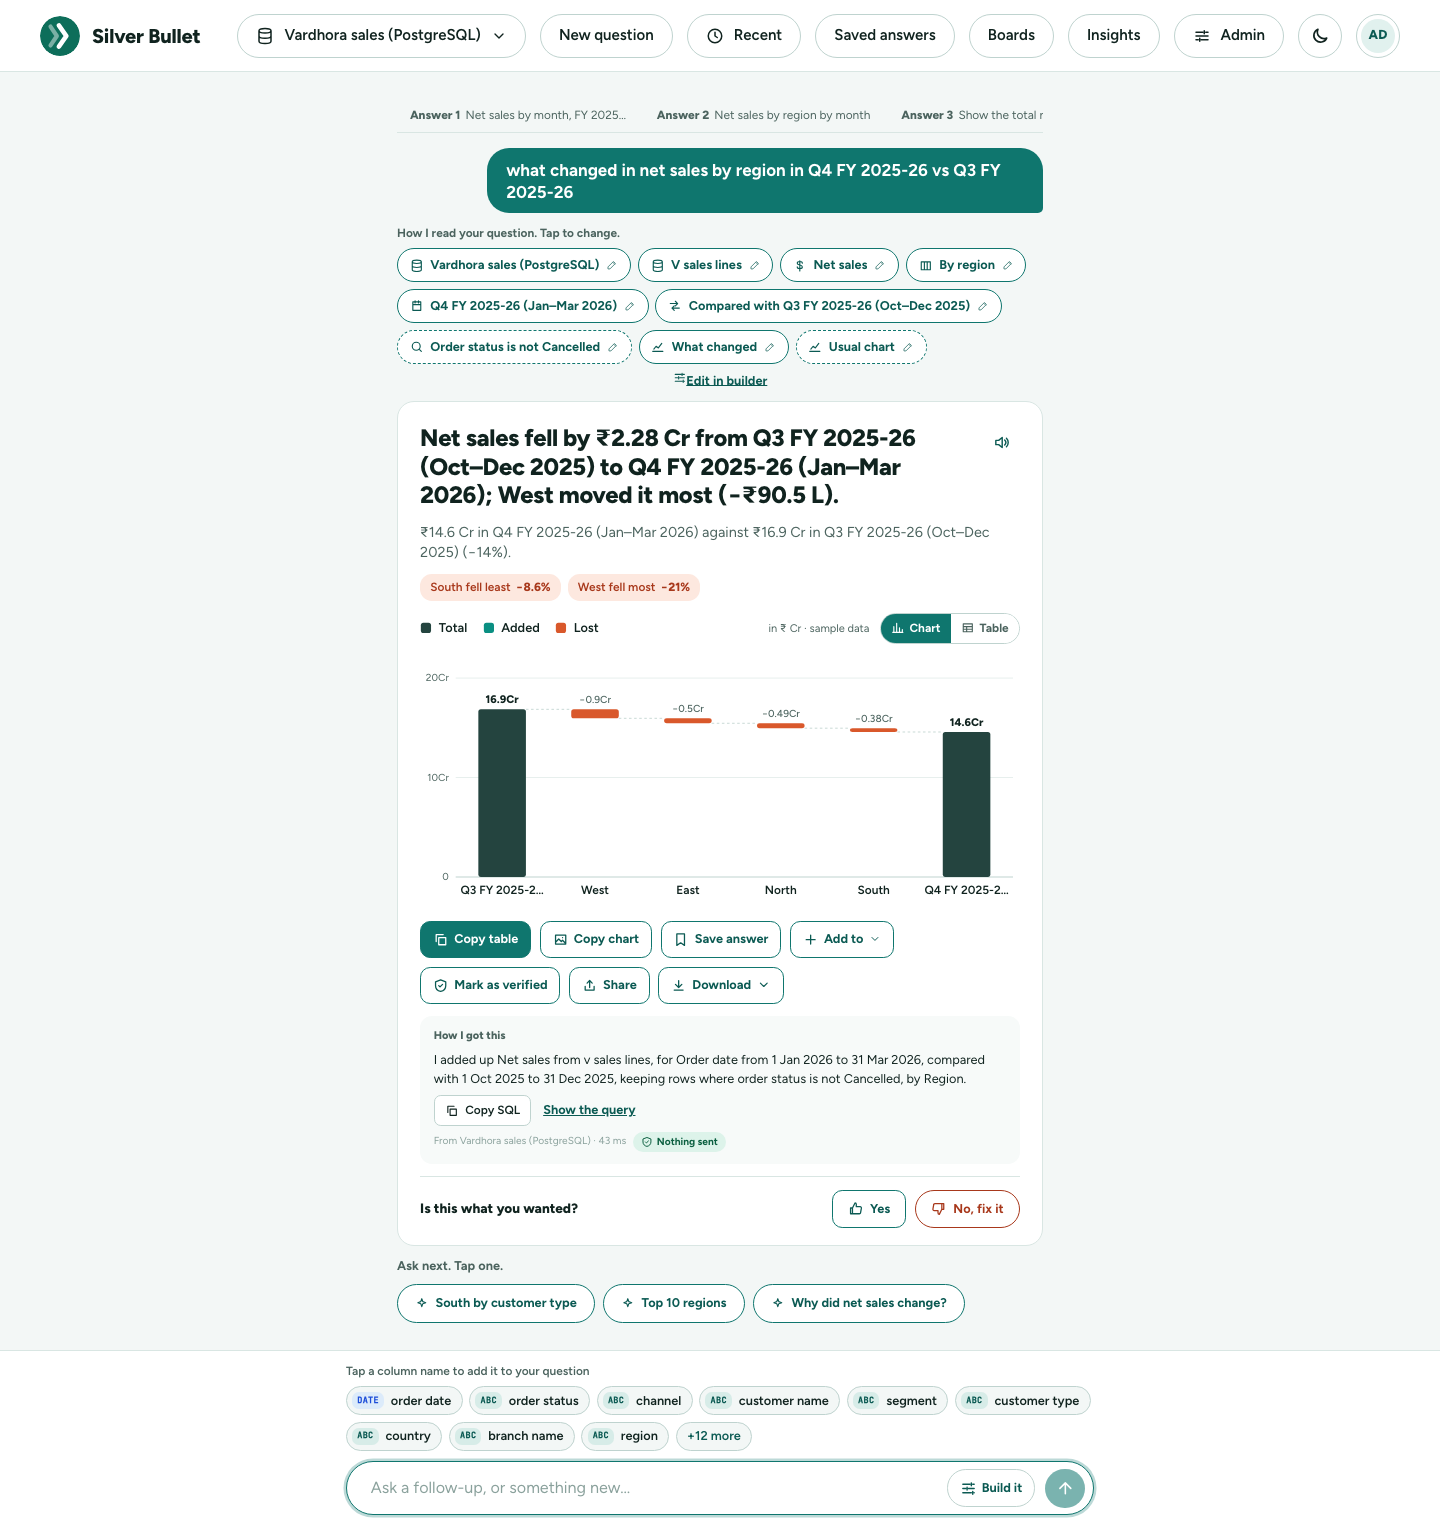
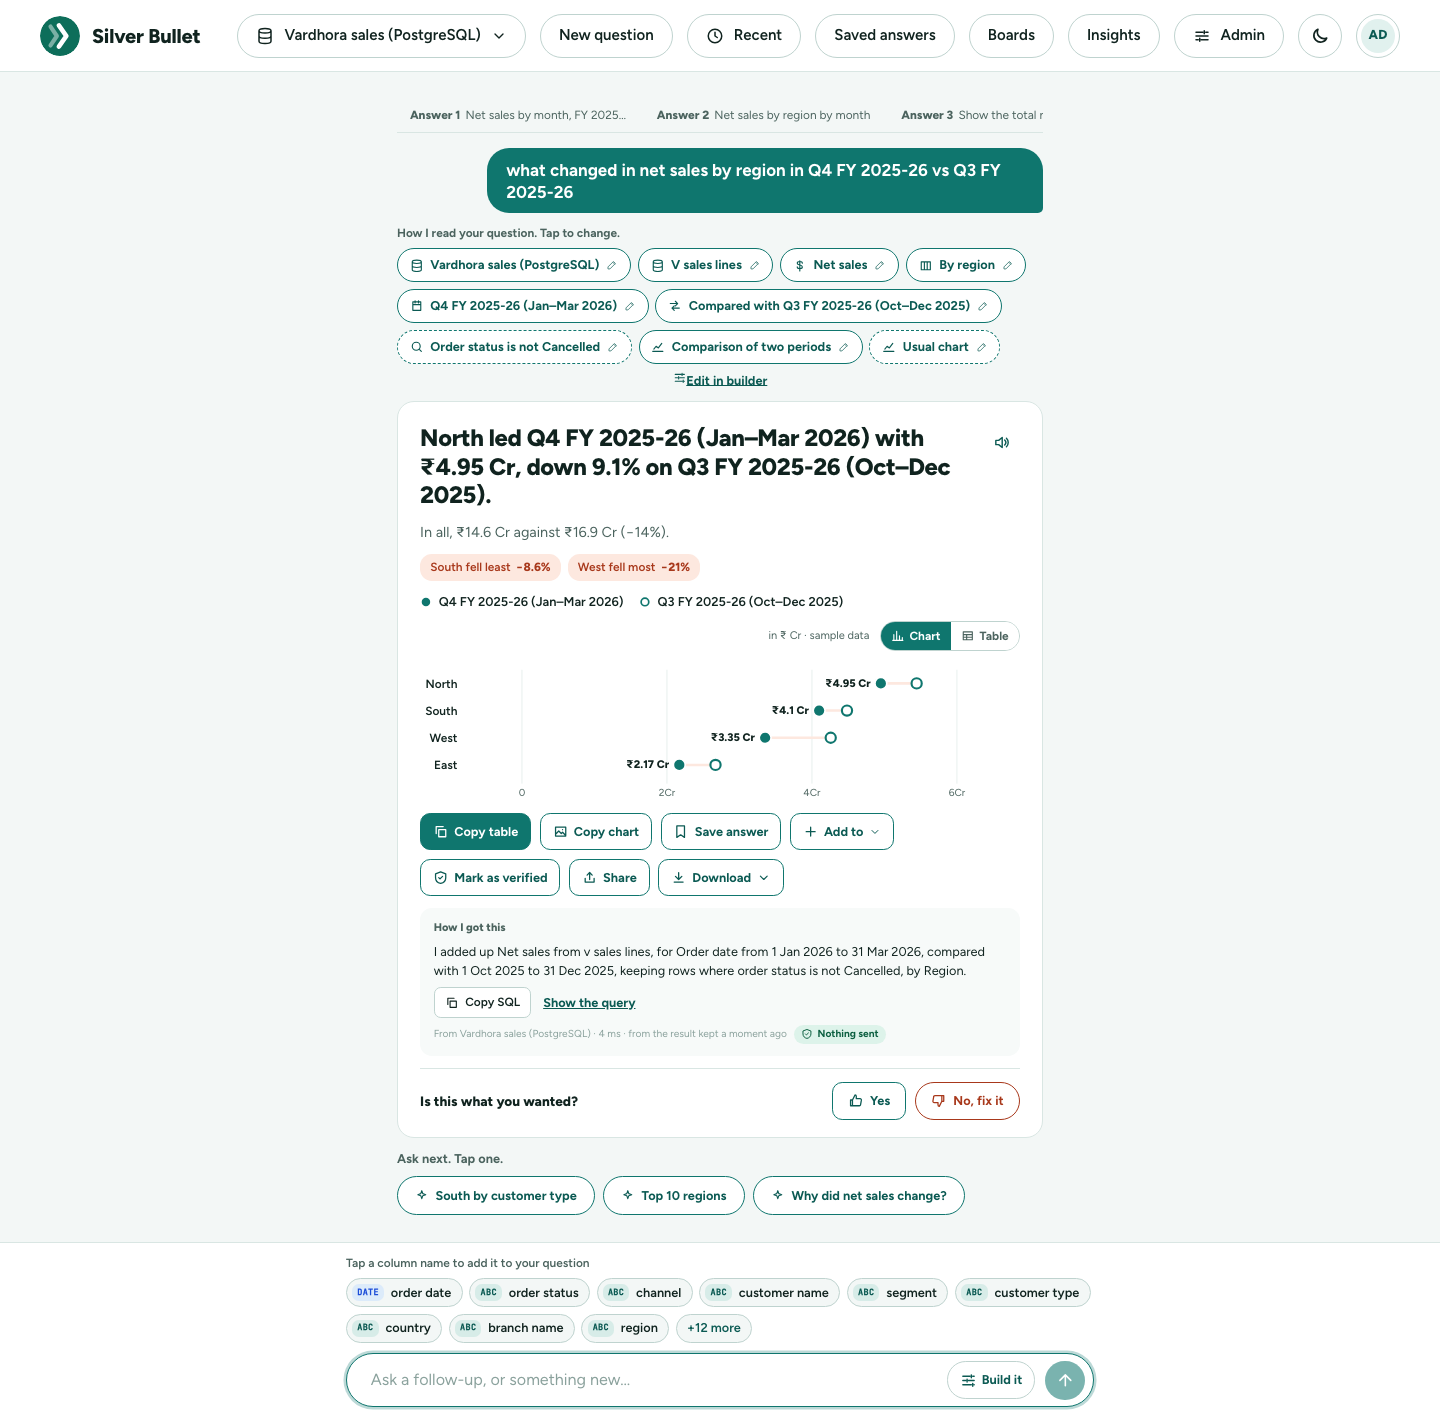
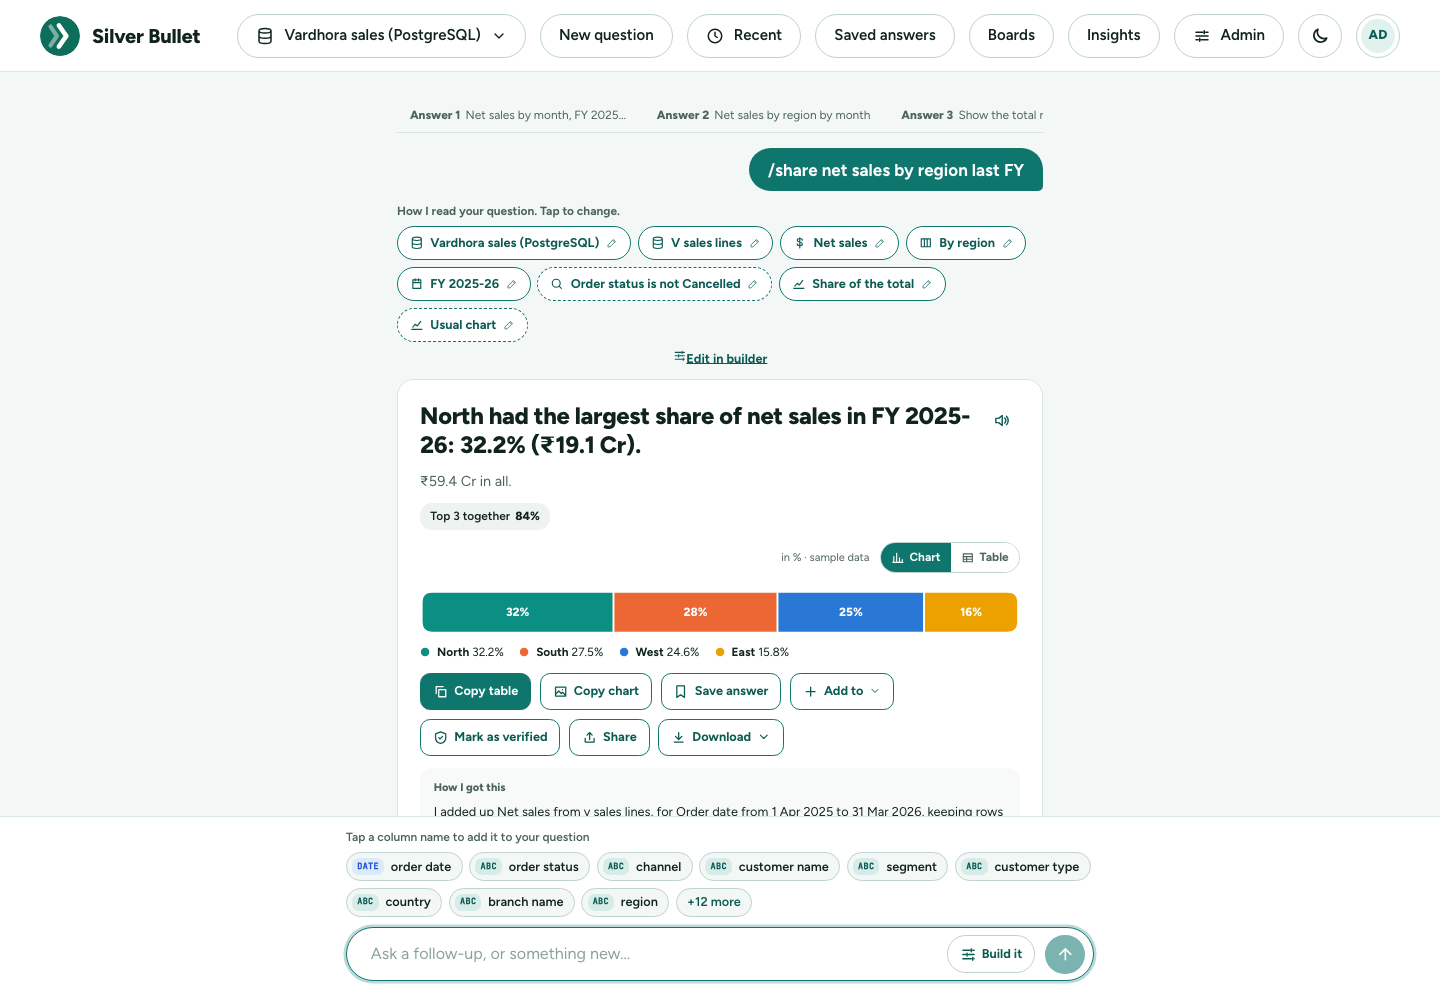
A trend with more than six lines opens as a table instead, because the chart would be a tangle; switch to Chart to see it anyway.
Asking for a chart
Name the chart in your question and Silver Bullet draws it:
| Say | You get | It needs |
|---|---|---|
| “show doughnut chart for the share of each category”, “… as a donut” | Doughnut chart, the total in the middle | one figure split into parts |
| “pie chart of net sales by region” | Pie chart | one figure split into parts |
| “spider chart of net sales by region”, “radar of …” | Spider (radar) chart | 3 to 16 items; several lines when split two ways |
| “histogram of order value”, “distribution of amount per customer”, “how is net sales spread across customers” | Histogram: how many rows (or customers) fall in each range | one figure |
| “scatter plot of net sales vs discount by customer” | Scatter plot: one point per customer, and how much the two figures move together | two figures |
| “bubble chart of net sales and discount by customer” | Bubble chart: like a scatter plot, the bubble’s size a third figure (or the number of rows) | two or three figures |
| “… as a bar chart”, “… line chart”, “… in a table” | bars, a line, or the table first | nothing more |
A pie or doughnut shows eight slices at most; the smaller parts are added together as Others. A histogram’s headline says where most values are (“Most customers have net sales between ₹50,000 and ₹1 L: 30 of 50”). A scatter or bubble chart names its points when there are 12 or fewer; point at any point to see its name and figures.
If the answer cannot be drawn that way (a pie chart of a single number, a spider chart of two items), you get the usual chart and a note under the answer saying why.
The Chart chip under “How I read your question” shows the chart you asked for, or Usual chart. Tap it to draw the same answer another way; the line under each chart’s name says what it will do. On an answer with one figure (“net sales by region”), a scatter plot adds the table’s next figure to plot against, and a bubble chart also sizes the bubbles by the number of rows (the added figures show as chips you can change). A histogram of fewer than 12 groups (four regions) would say nothing, so it shows how the figure is spread over the rows instead, with a note.
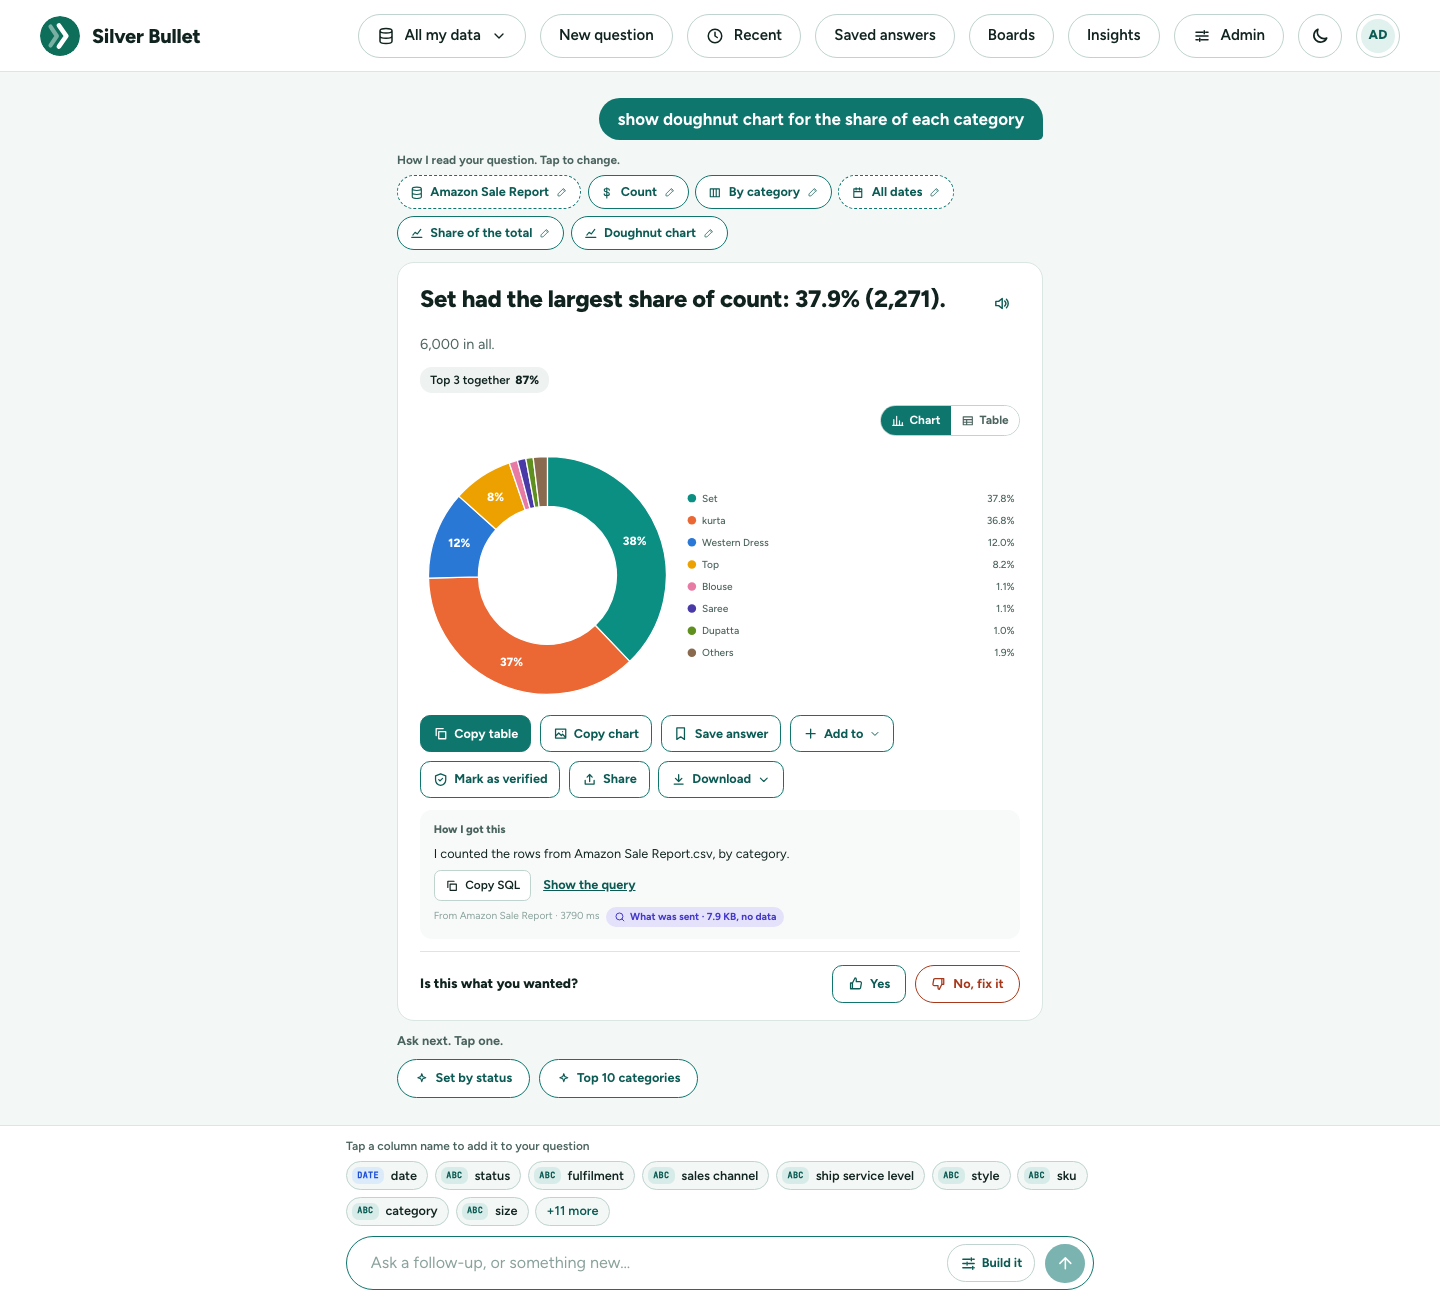
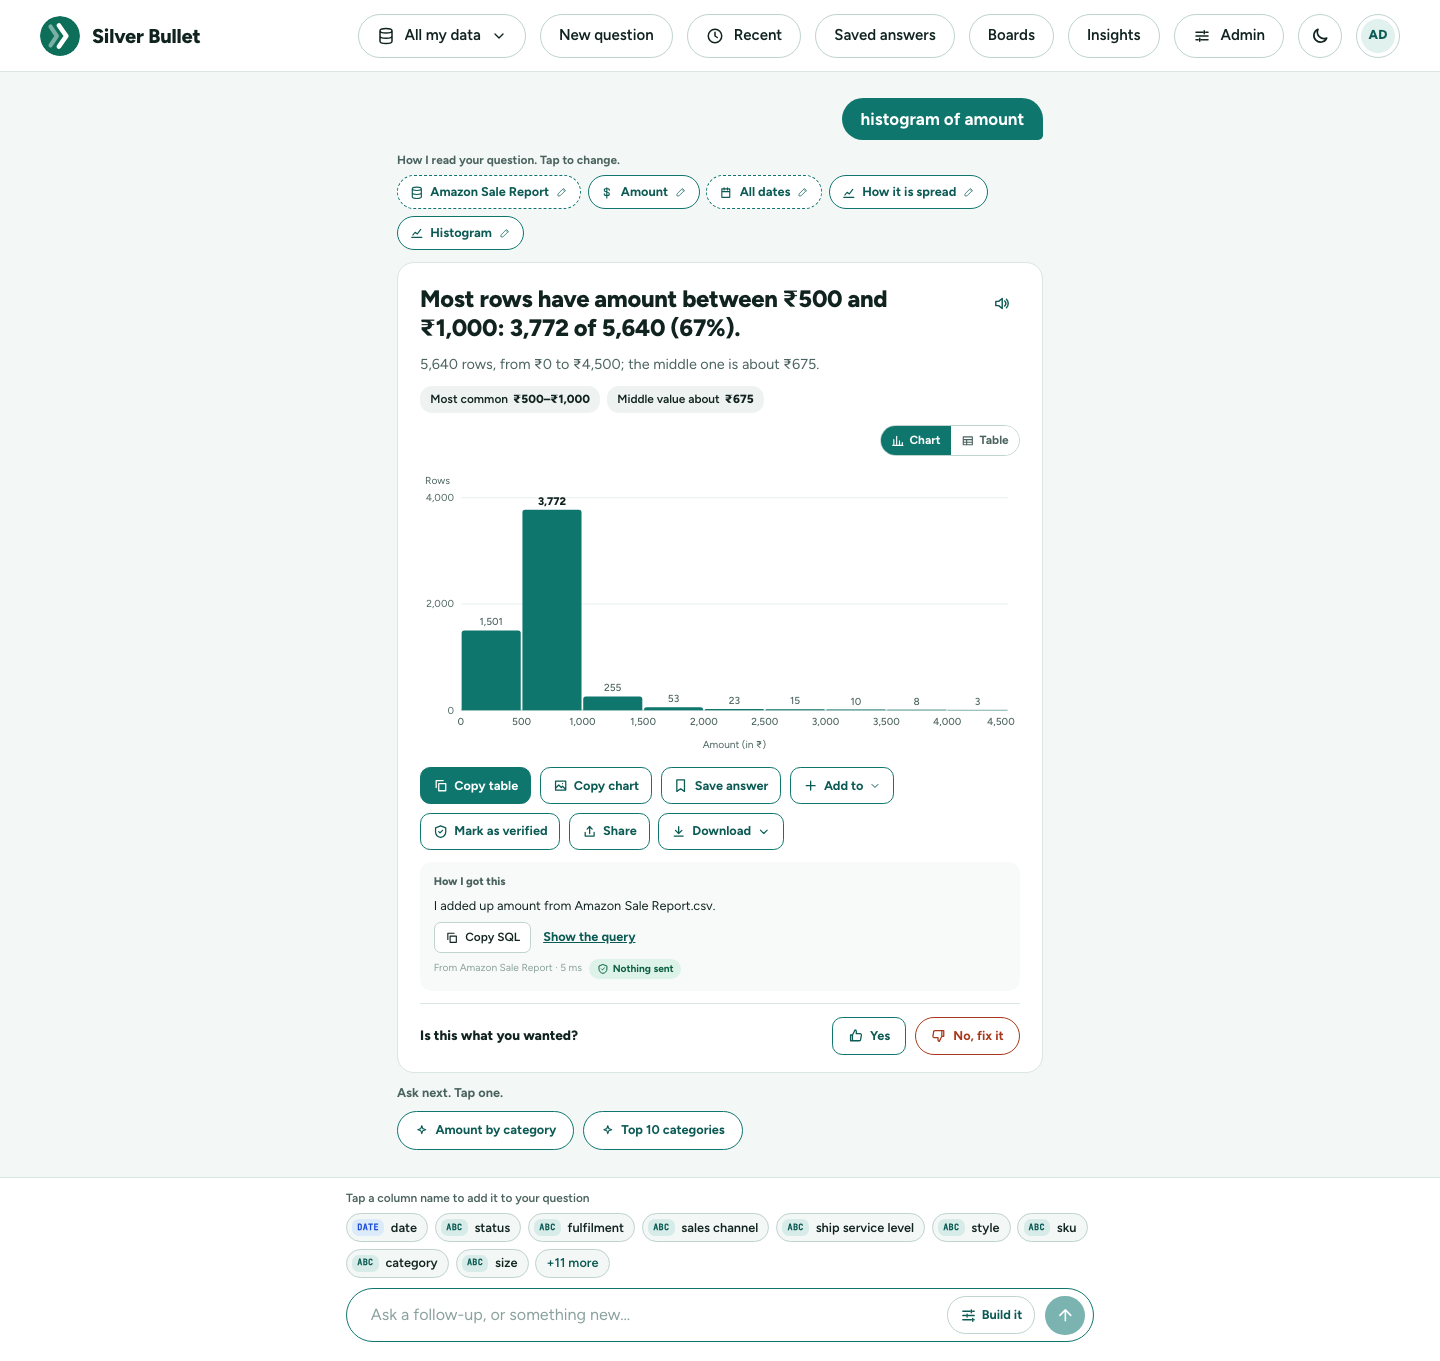
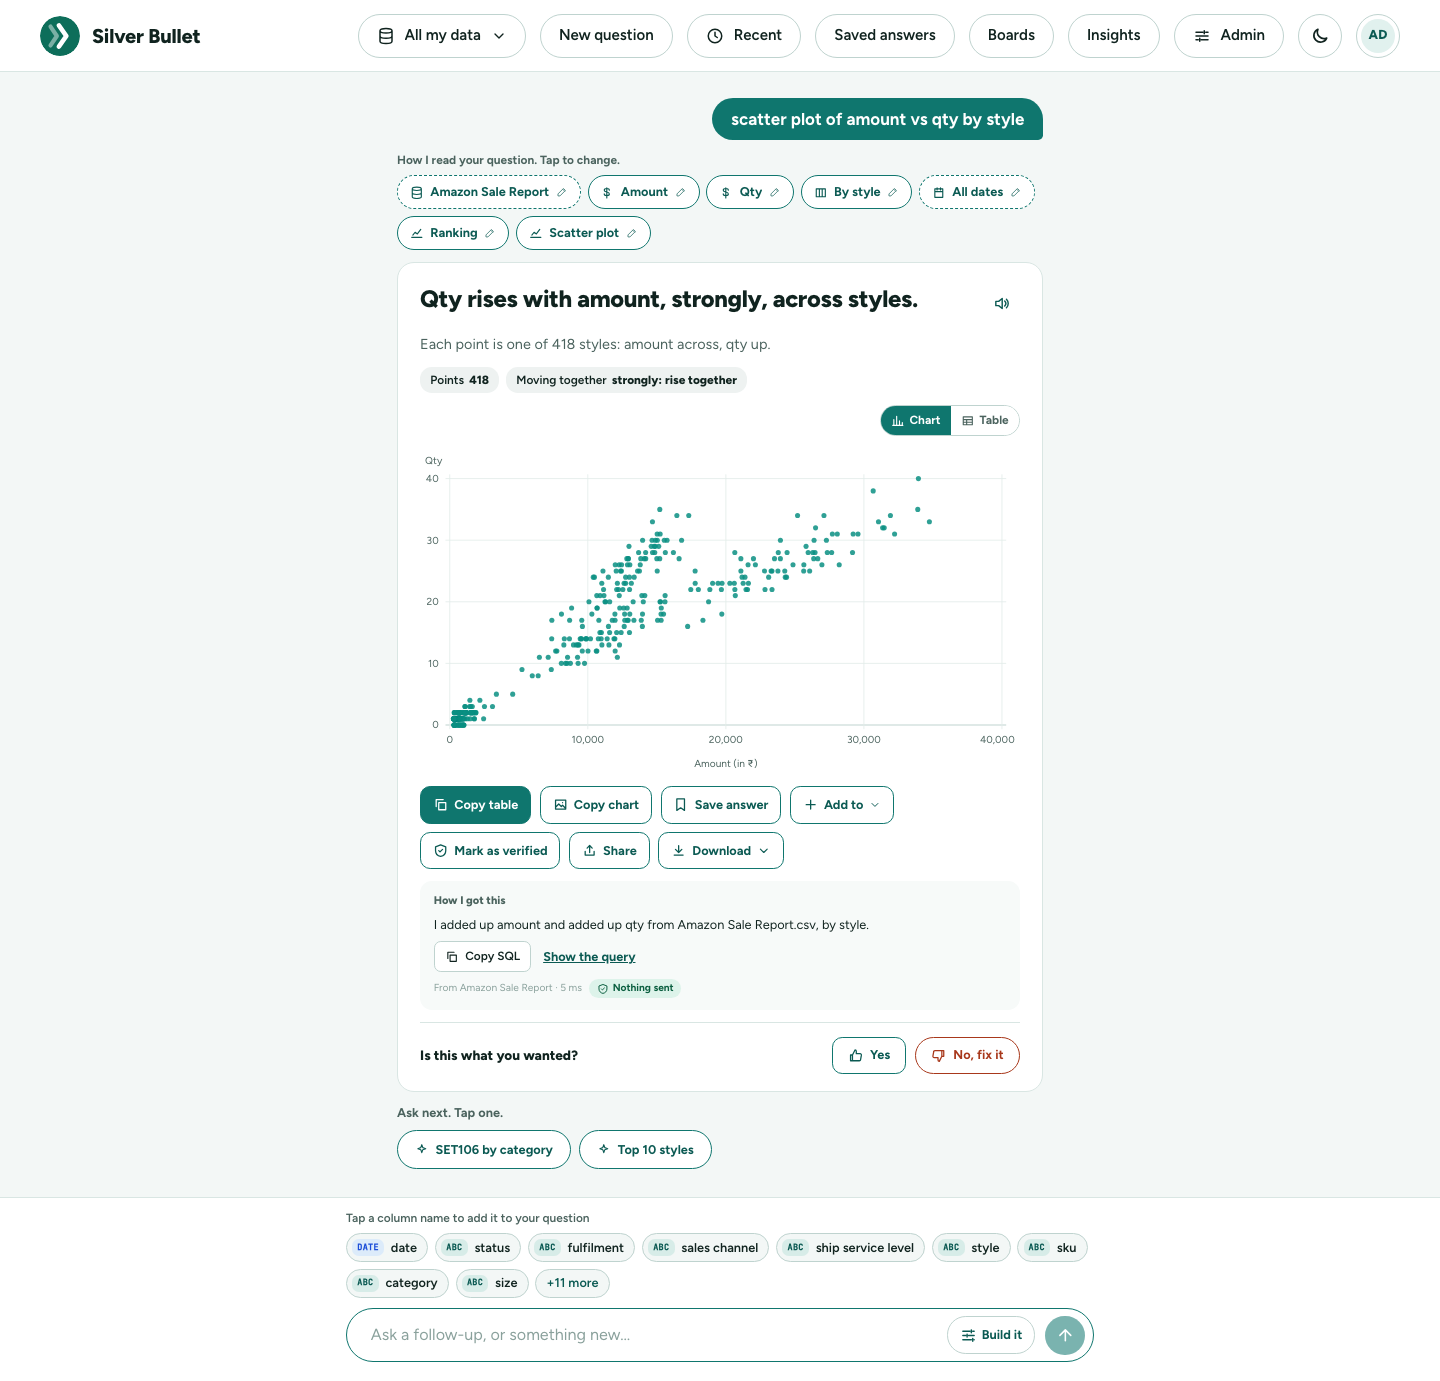
Table view
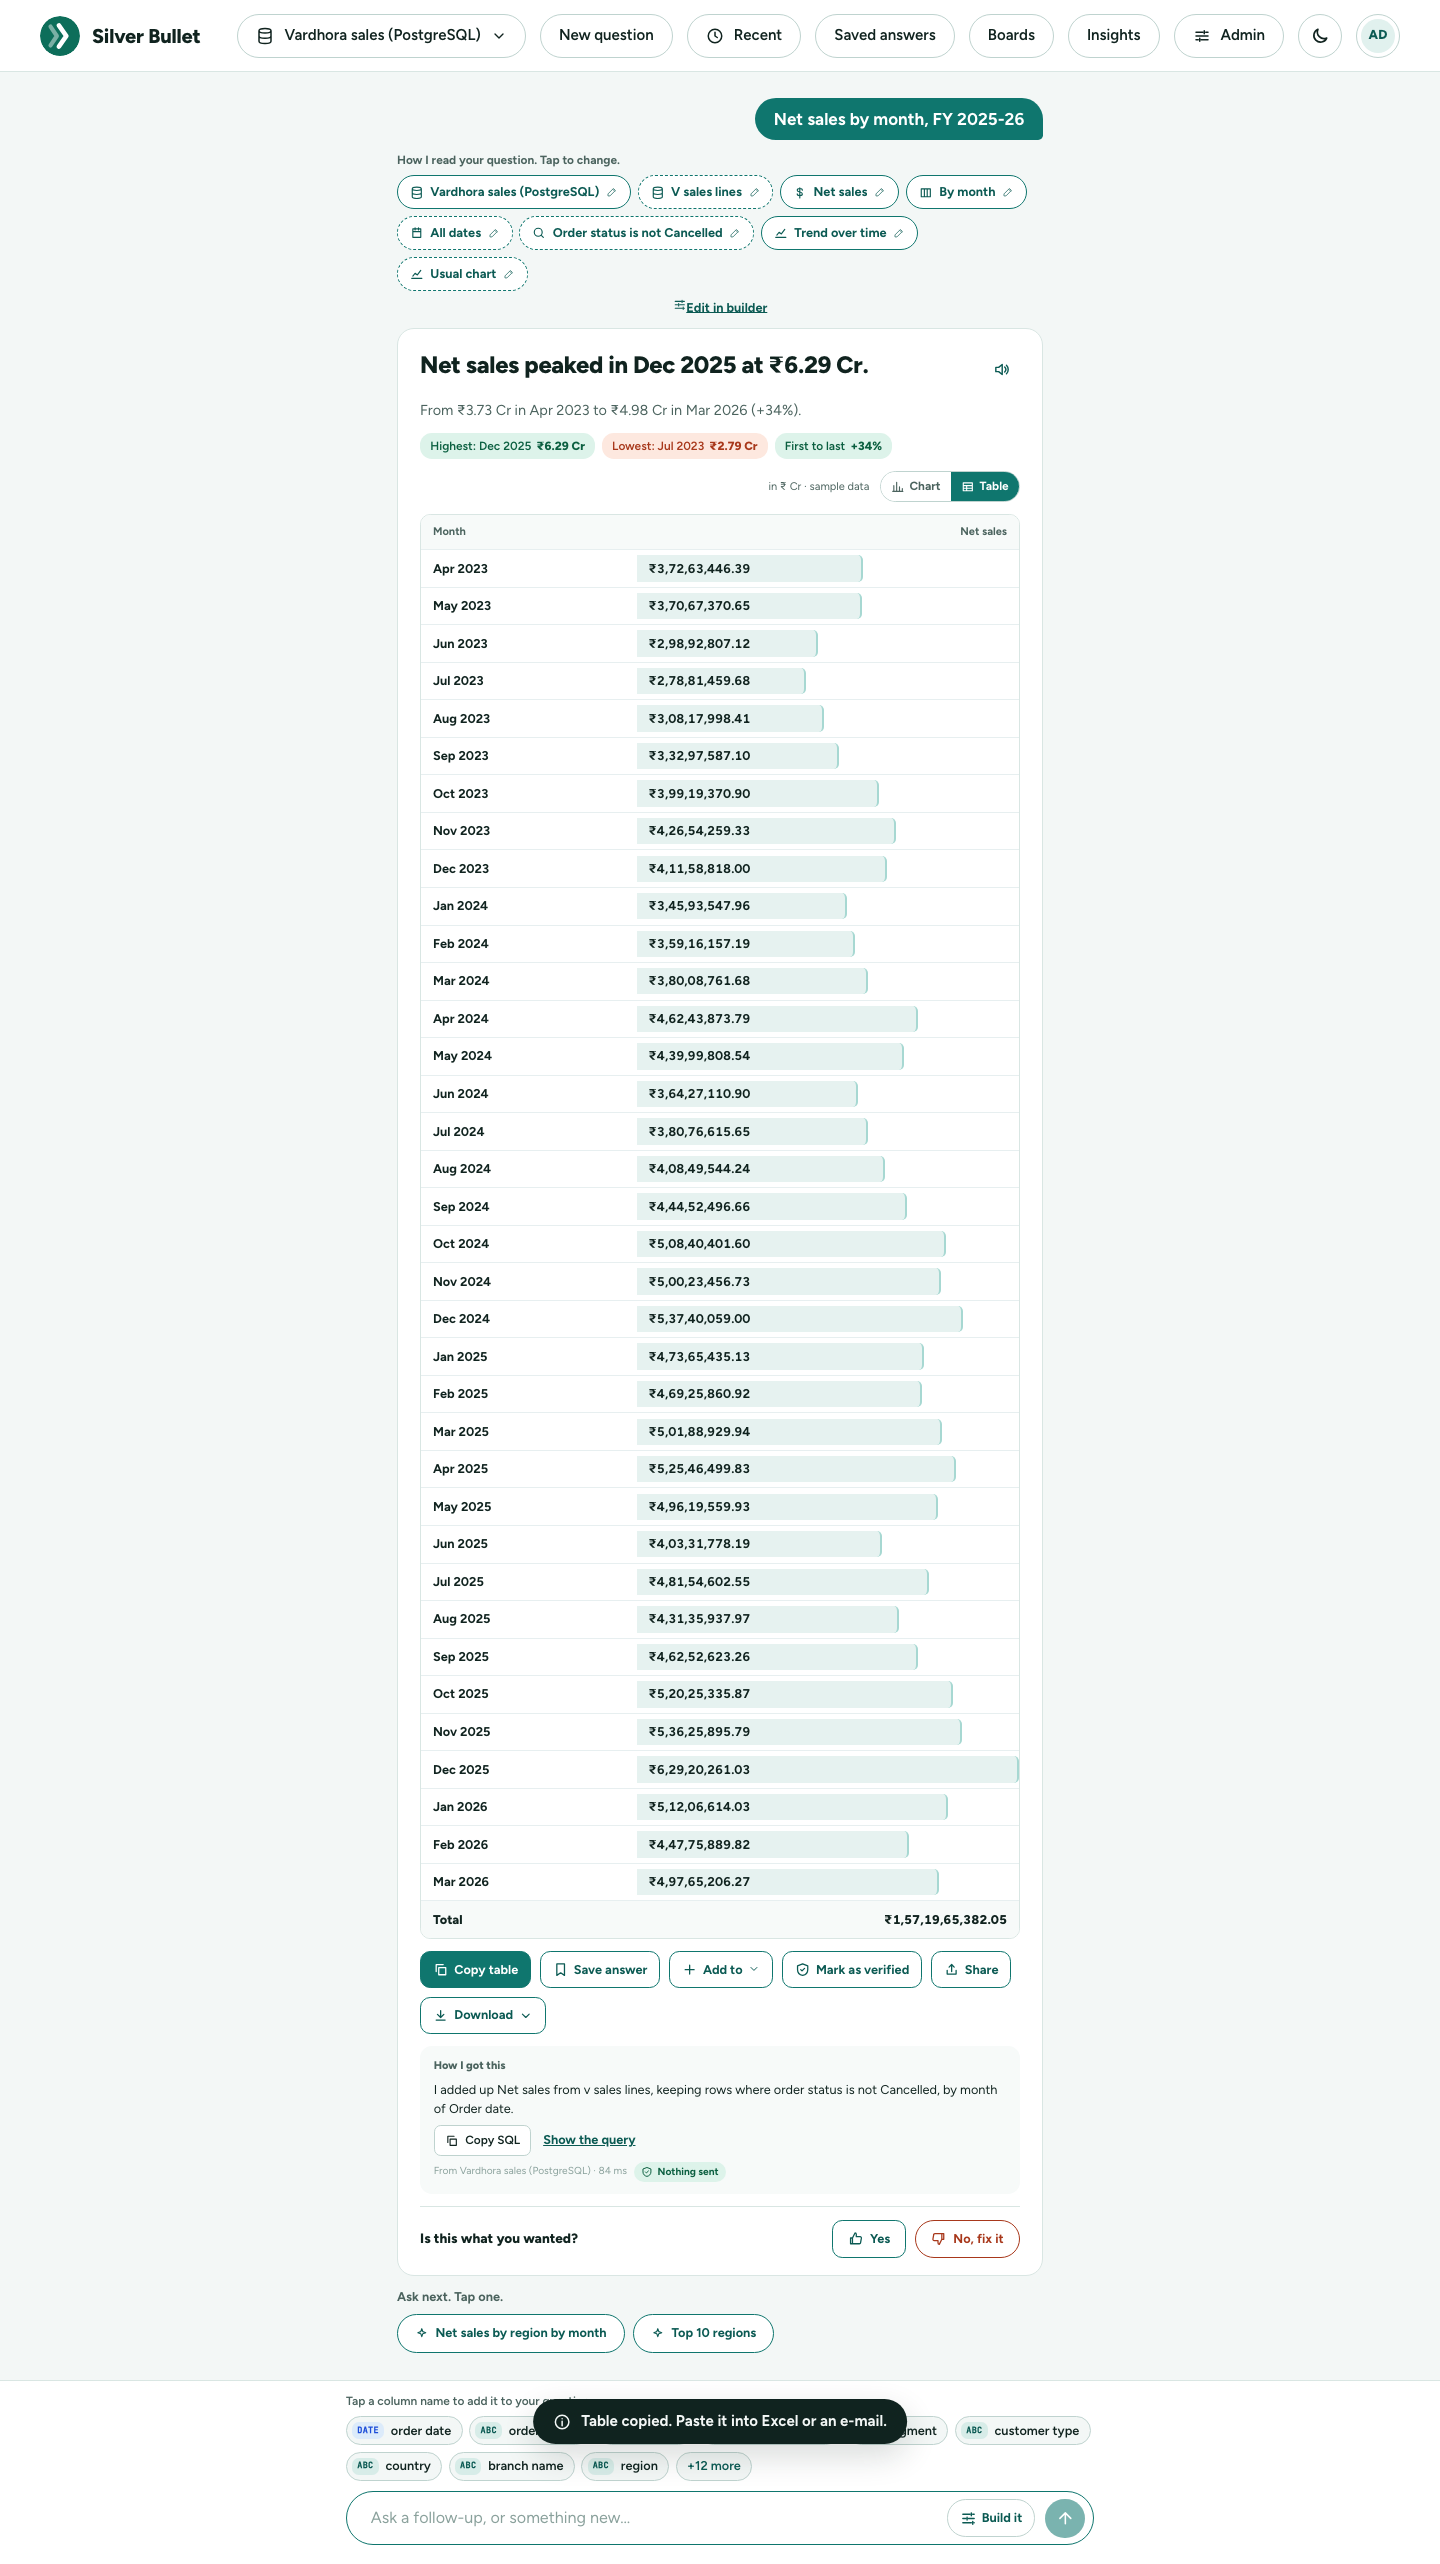
The Chart / Table switch shows the same answer as a table:
- numbers in full, the Indian way (₹3,72,63,446.39);
- a light bar inside the main figure’s cells, so the biggest stands out;
- for comparisons, a change column in green (▲) or red (▼);
- a Total row where adding up makes sense.
Long answers say Showing the first N rows.
Units, lakh and crore, sample data
Every bar chart, line, waterfall and dot chart names both axes: the figure with its unit on one (Net sales (in ₹ Cr), Share of net sales (%)) and what it is split by on the other (Month, Region). Pie, doughnut and spider charts, which have no axes, say the unit in the caption above them; so does an answer kept from an earlier version (ask it again for the named axes). Figures in the headline and chart are shortened the Indian way: ₹25.7 L is 25.7 lakh (₹25,70,000); ₹14.6 Cr is 14.6 crore (₹14,60,00,000). The table always shows the full figure.
sample data in the caption means the answer comes from the sample business (Vardhora, from the Test Kit), not from your own data.
Verified and Not yet reviewed
- Verified answer · checked by you (green, with the date) means you confirmed this reading, with Mark as verified or under Your corrections. Answered from: “…” shows the verified question your question matched.
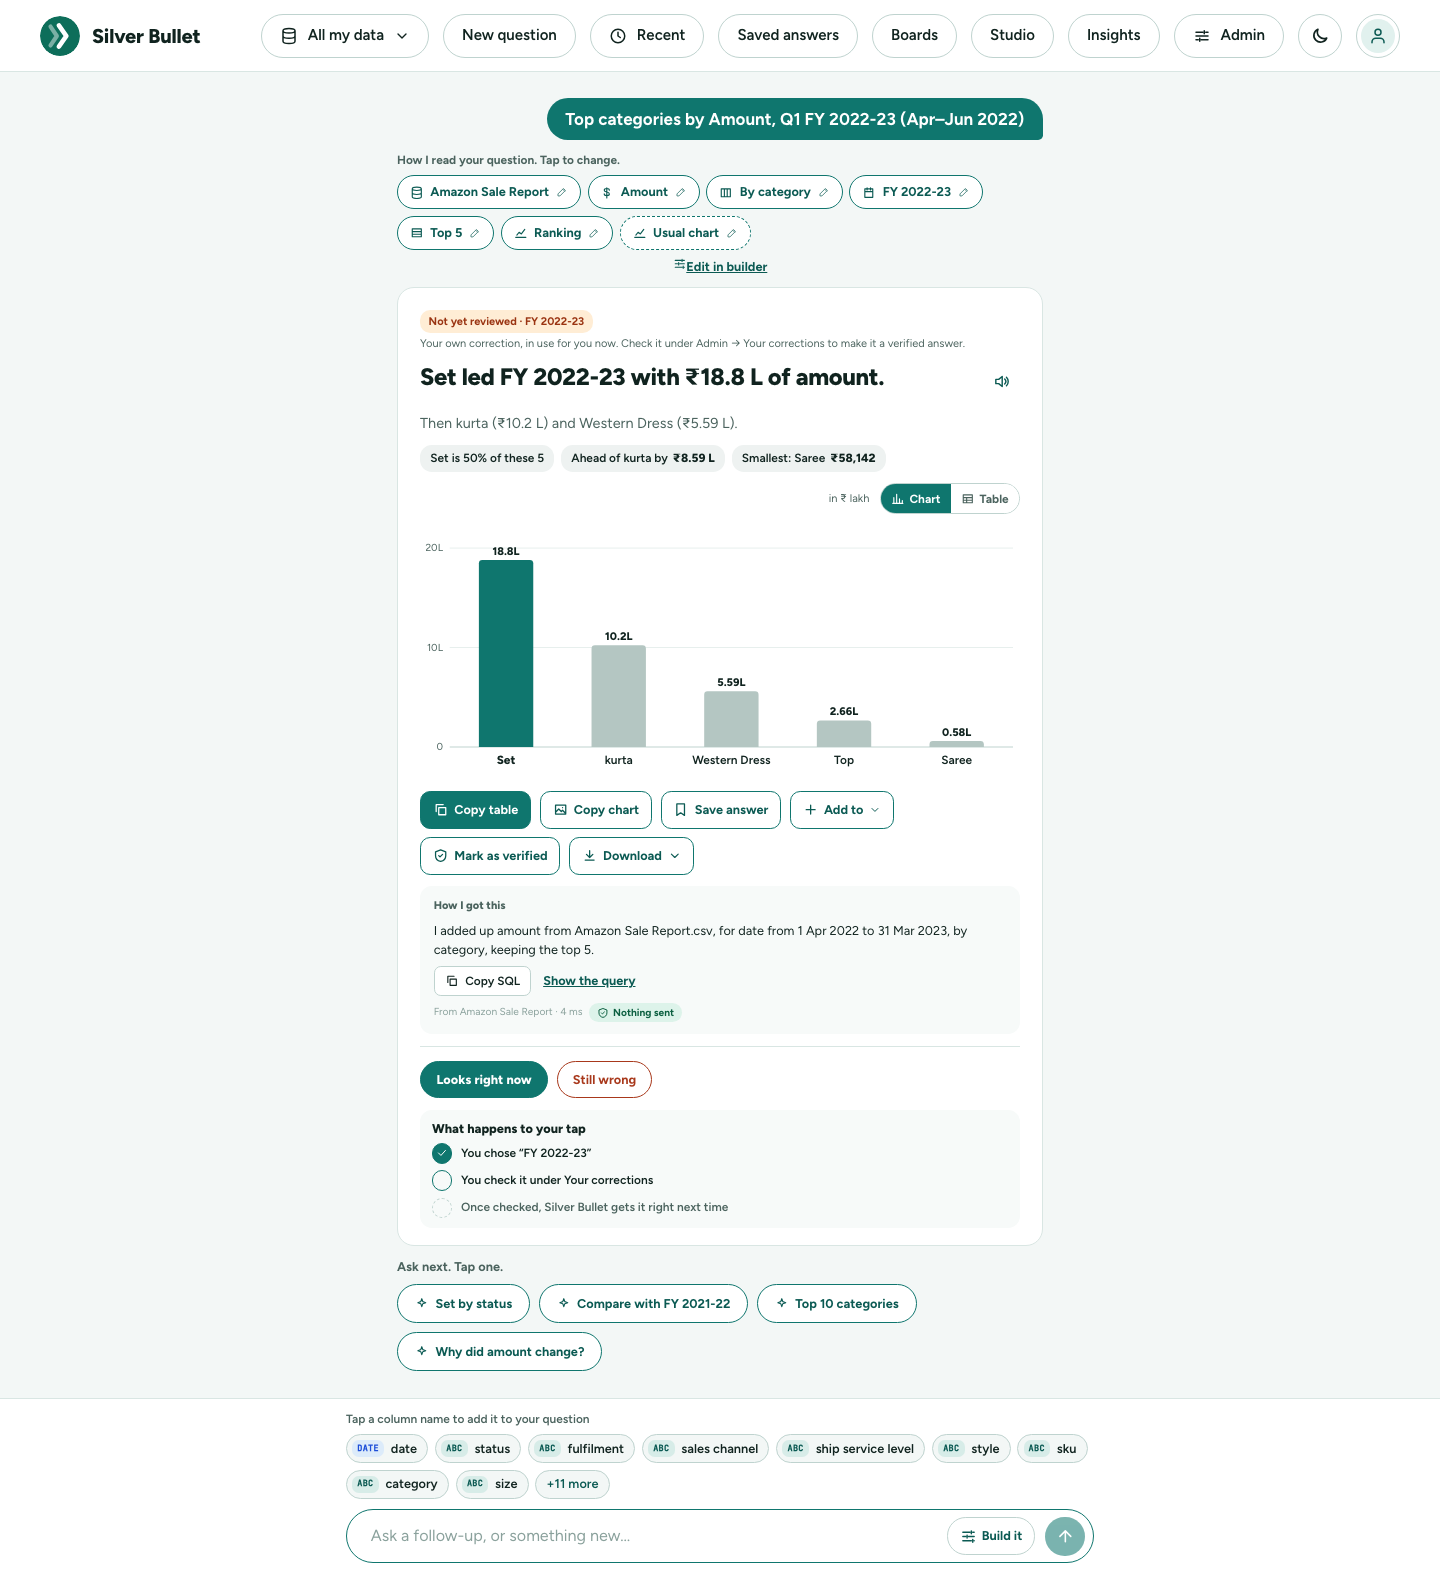
- Not yet reviewed (amber) marks your own correction from No, fix it: Your own correction, in use for you now. Check it under Admin → Your corrections to make it a verified answer.
What to do with an answer
The buttons under the chart or table:
| Button | What it does |
|---|---|
| Copy table | Copies the table, ready to paste into Excel or an e-mail. |
| Copy chart | Copies the chart as a picture (shown in chart view). A browser that cannot copy pictures downloads it instead. |
| Save answer | Keeps the question under Saved answers, to run again on the latest data. |
| Add to | A board… adds the answer to a board as a tile; A brief… adds it to an executive brief. |
| Download | Excel (.xlsx) or CSV of the table; Picture (.png) of the chart (in chart view). |
| Mark as verified | Makes this reading a verified answer, after the safety check (see the Learning Engine guide). Every verified answer is listed under Admin → Your corrections → Verified answers, where it can be opened or removed. |
A text cell that a spreadsheet would read as a formula (starting with =,
+, - or @) is written so that it opens as text, in a CSV download and
in a copied table.
How I got this
How I got this says in plain words what was done, for example I added up Net sales from v sales lines, for Order date from 1 Apr 2025 to 31 Mar 2026, keeping rows where order status is not Cancelled, by Region. Underneath: the source and how long it took. Copy SQL and Show the query give the exact read-only query that ran.
What was sent
On every answer a small lens says Nothing sent (the question was answered without an AI model) or What was sent · 2.1 KB, no data. It opens that question’s page in Activity & trust (see Activity & trust).
Is this what you wanted?
Under every answer: Yes or No, fix it.
- Yes says the answer was right: Thanks. Answers you confirm help Silver Bullet get it right next time.
- No, fix it opens a three-step correction, with no typing needed.
No, fix it: three taps
1. Say what went wrong. Choose one: The numbers look wrong, Wrong time period, It misread a word I used, Something is missing, The chart is confusing, Something else.
2. Pick what you meant. Did you mean one of these? Silver Bullet says what it used (I used FY 2025-26.) and offers other readings, each with its real figure from your data, for example Same period last year: FY 2024-25 · ₹25.7 L. Tap the one you meant. (‹ with the problem’s name takes you back to step 1.)
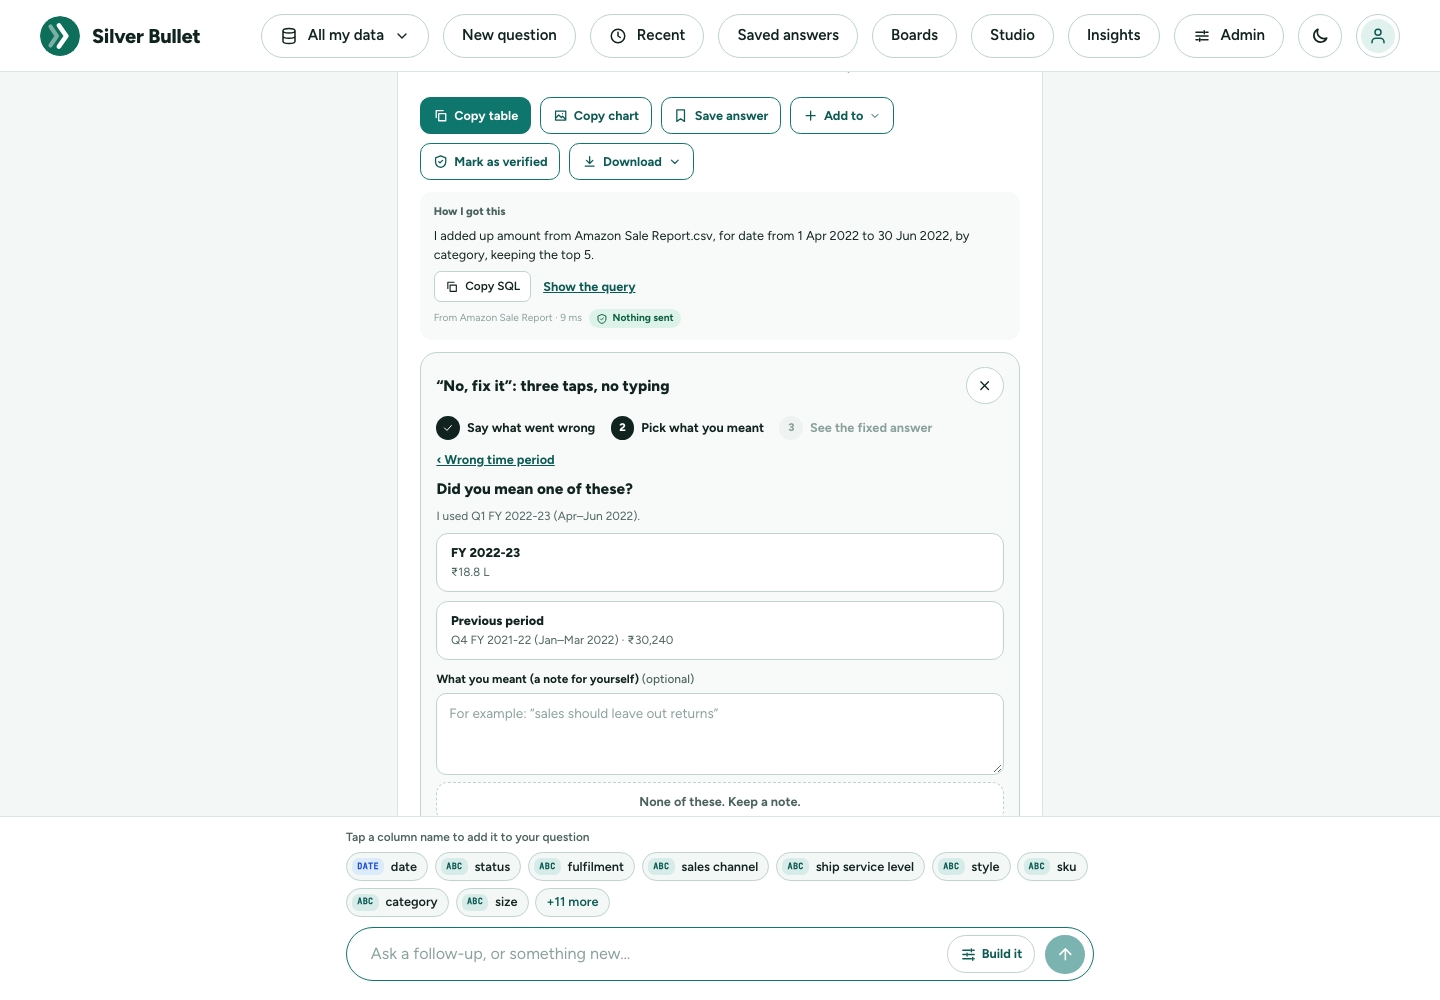
If none fits, write what you meant in What you meant (a note for yourself) and press None of these. Keep a note. The note is kept under Your corrections, where you can fix the question with a rule or a word in the data dictionary.
3. See the fixed answer. The answer is worked out again your way and marked Not yet reviewed. Press Looks right now if it is, or Still wrong to try again.
When the answer needs its own query
Some wrong answers are not a misread word or period: the question needs a calculation, a join or a condition Silver Bullet does not know (count each order once, not each line, only invoiced orders). Write what you expected in the note box and press I will write the right query myself. The question, how Silver Bullet read it and the query it ran are kept under Your corrections, where you (or someone who knows the database, sitting with you) write the query the question should have had. It runs through the same safety layers as every question, and is in use for you at once, marked Verified by you. Once you publish it after the safety check, the same question asked again, in other words, with another period, value or top N, or as a short follow-up (the same for last month, only West), is answered with that query too. The Administration Guide shows the screen.
What happens next
What happens to your tap shows the steps:
- You chose a reading (or kept a note).
- You check it under Your corrections.
- Once checked, Silver Bullet gets it right next time.
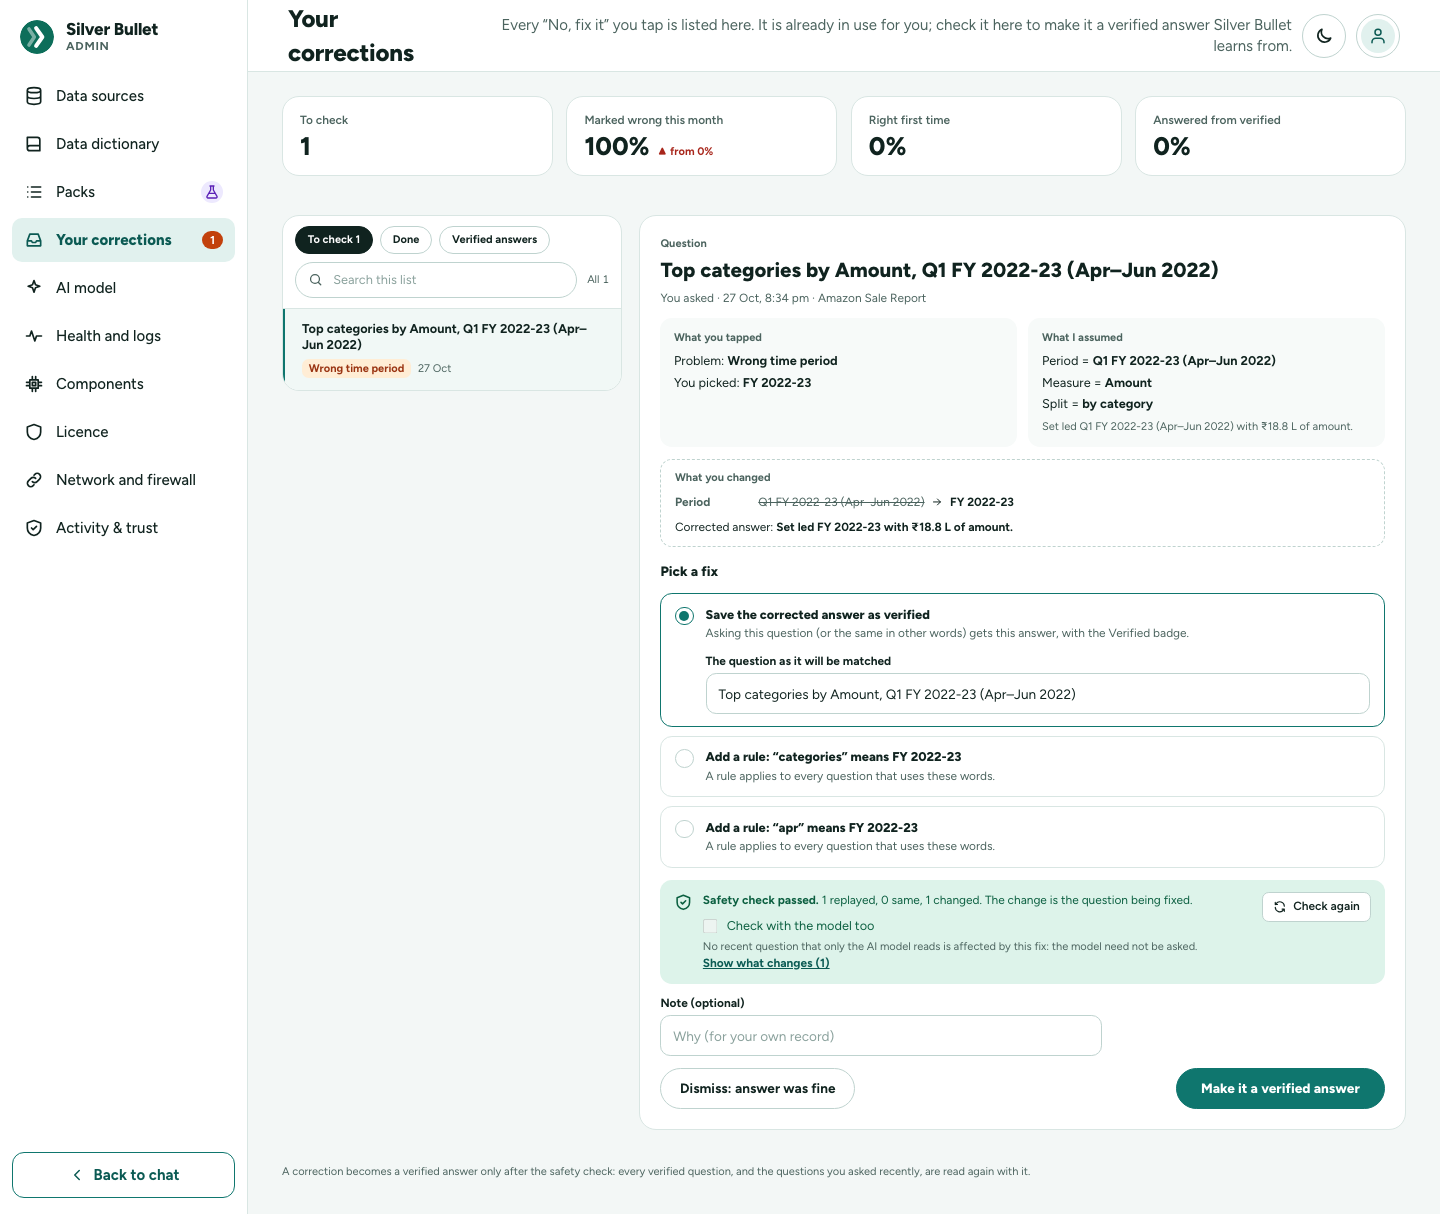
The correction is in use for you at once (Thanks. Fixed for you now; it is listed under Your corrections.). To make it a verified answer, open Admin → Your corrections, pick the correction, press Run the safety check, then Make it a verified answer: the same question in other words is then answered your way too. The safety check reads your verified questions and recent questions again with the fix, and shows any answer it would change. The Learning Engine guide explains it.
Ask next
Ask next. Tap one. under each answer suggests the obvious follow-ups: the leader split another way (North by customer type), a comparison with the year before (Compare with FY 2024-25), a bigger ranking (Top 10 regions), or Why did net sales change?. A tap asks it at once, in the same conversation.
Read it to me, and voice input
Read it to me is the speaker button beside the headline. It reads the headline and supporting line aloud using your computer’s own voice; press it again to stop. A browser that cannot read aloud says so.
Voice input (a microphone button in the ask box) is off until you turn it on under Admin → AI model → Voice input, and appears only in a browser that supports it. Press it, speak your question, and it is typed for you. The first time it reminds you: Voice input uses your browser’s speech recognition. In Chrome and Edge the audio is sent to Google to turn it into text. If the microphone is blocked, allow it in the browser’s address bar.
Conversations
Each question you ask from the home page starts a conversation. Asking again from inside it adds another answer:
- Answer tabs along the top (Answer 1, Answer 2, …) switch between the answers of this conversation; + starts a new question.
- New question in the top bar goes back to the home page.
- Recent in the top bar lists your recent conversations, newest first.
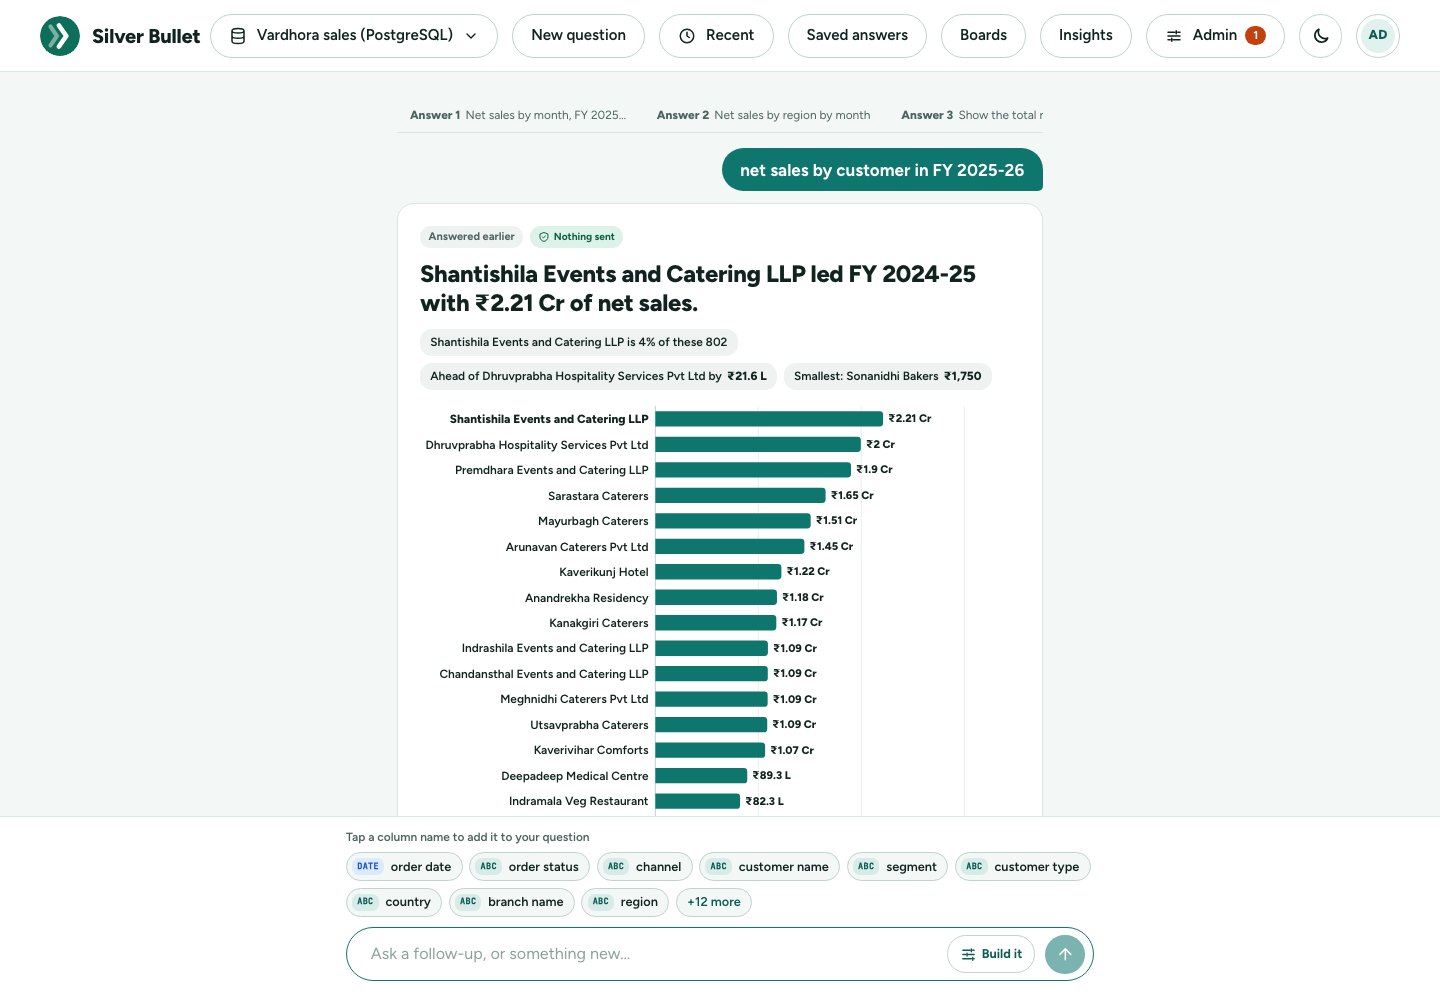
An answer from an earlier visit opens marked Answered earlier, as it was then. Press Show on latest data to work it out again now (or Ask again when it cannot be re-run as it is).
Saved answers
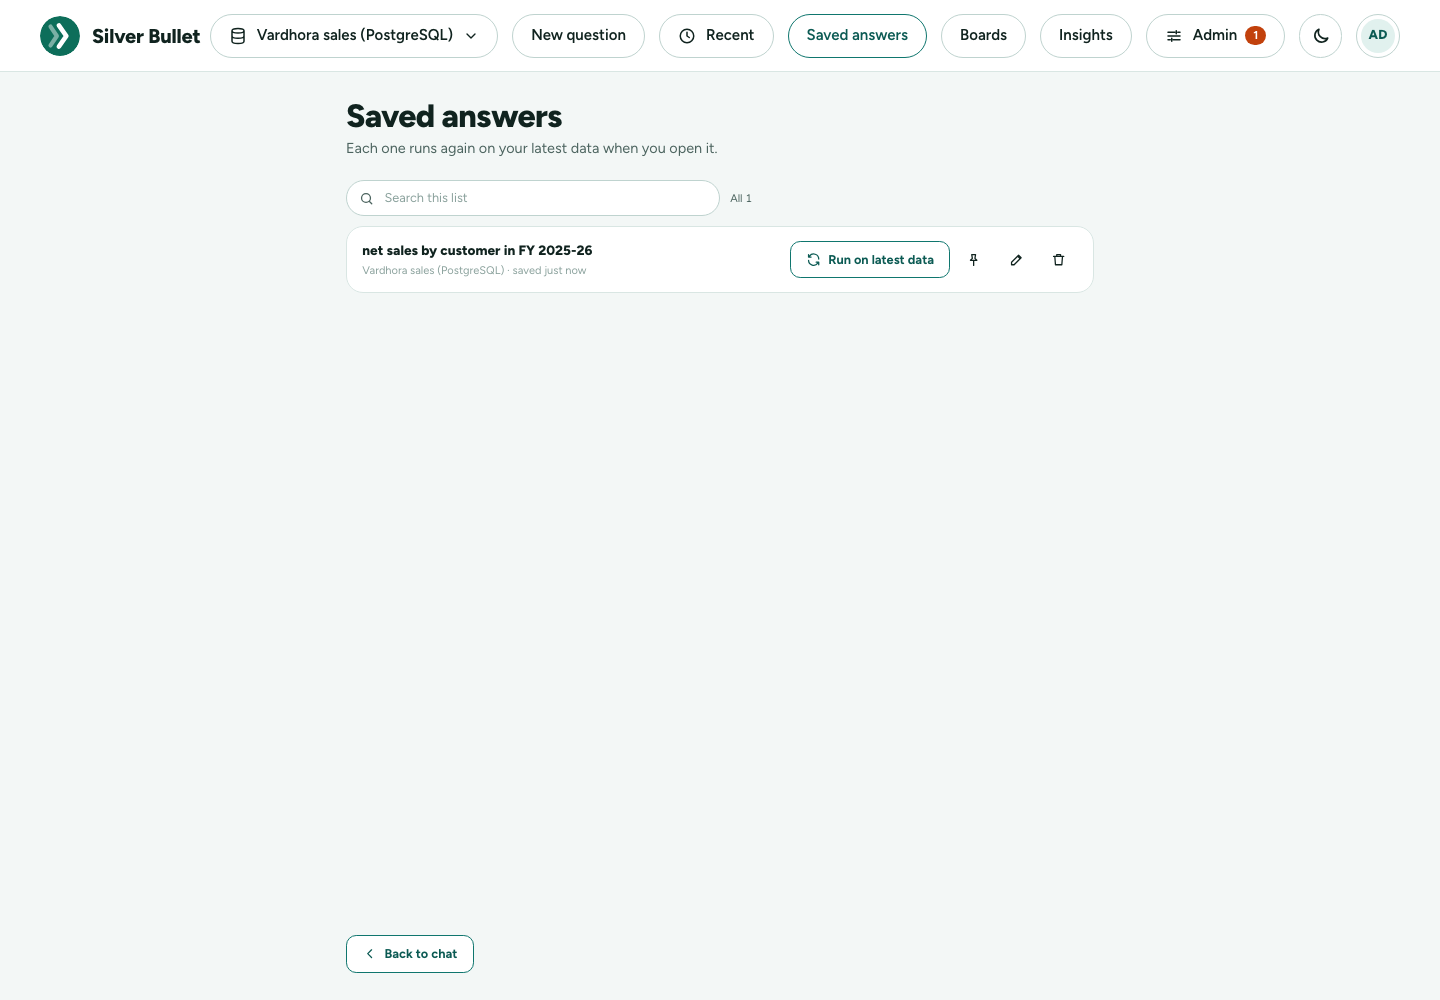
Save answer keeps a question you will want again. Saved answers in the top bar lists them: Each one runs again on your latest data when you open it.
- Run on latest data works the answer out again now.
- The pin button pins it to a board.
- The bin button removes it from your saved answers.
Boards
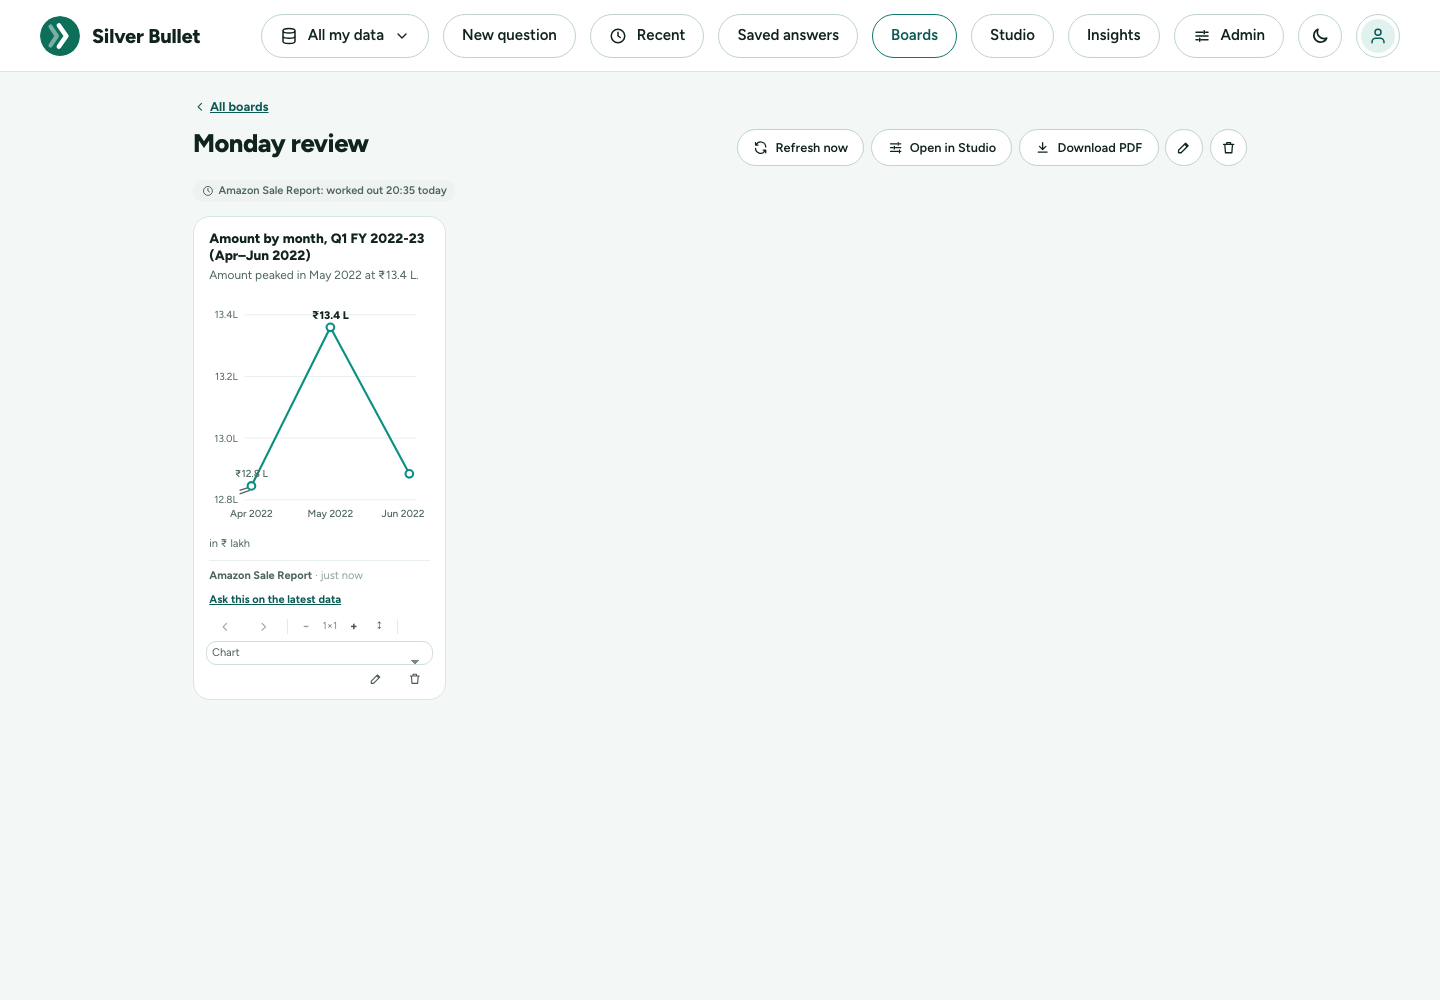
A board is a page of answers pinned as tiles: a Monday review, a regional dashboard. Tiles are worked out again on each source’s schedule, so opening a board is instant and queries nothing.
Pinning an answer
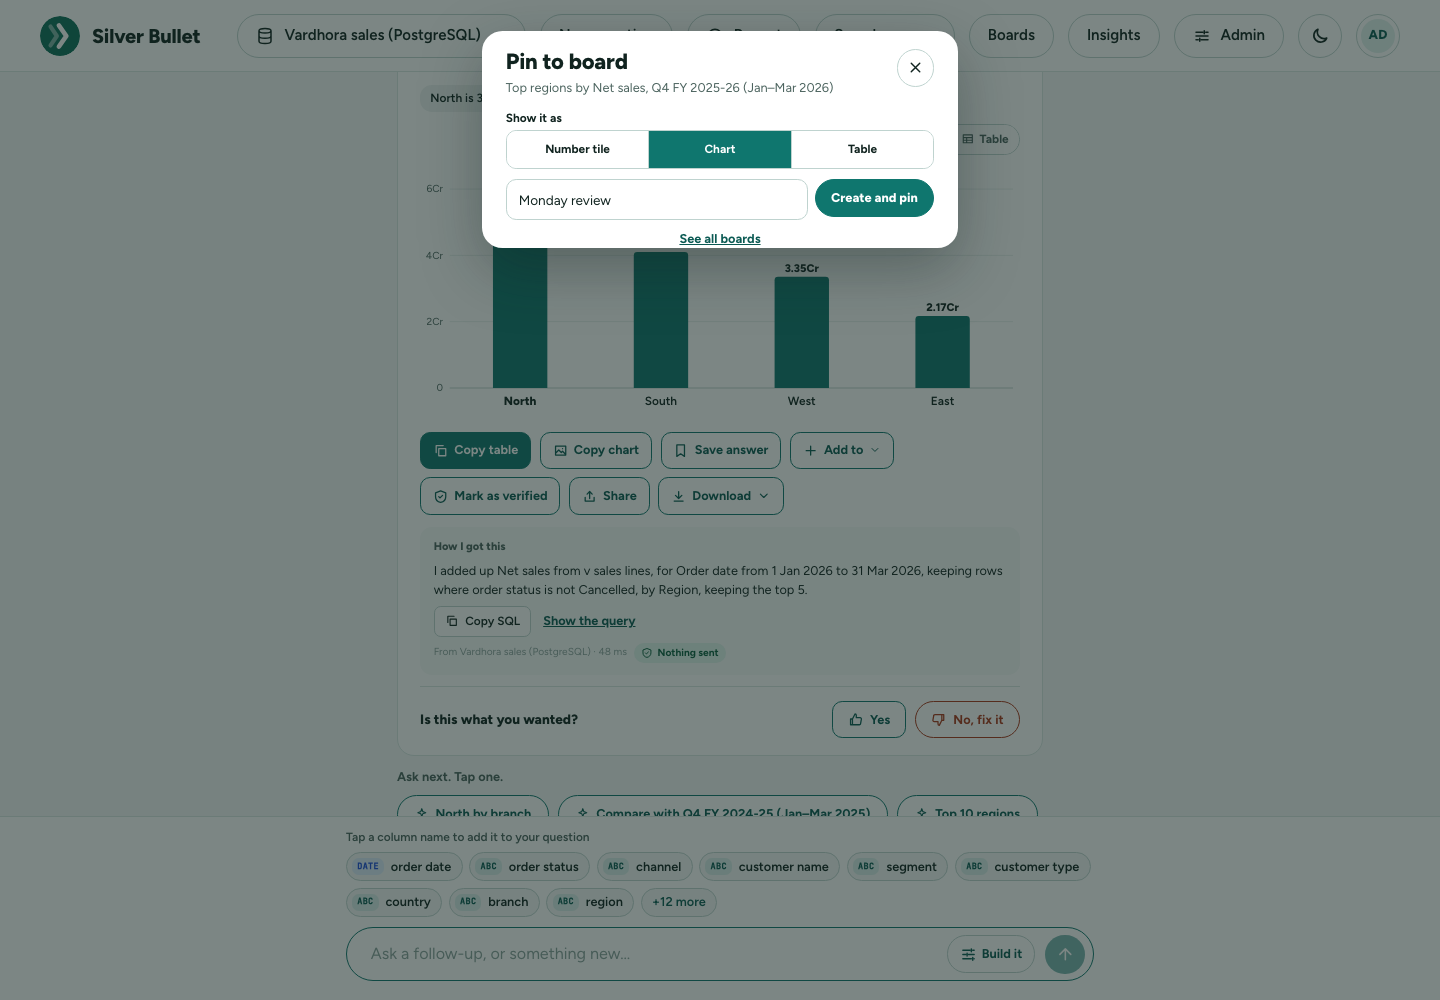
Press Add to → A board… under an answer (or the pin button on a saved answer). Choose Show it as: Number tile, Chart or Table. Then pick a board, or type a New board name and press Create and pin.
Making and arranging a board
Boards → New board: give it a Name and an optional Description. The pencil button renames it later; the bin deletes the board and its tiles (the answers themselves are kept).
On a board you can change:
- Drag a tile to move it, or use the arrows (Move earlier, Move later).
- Size: Narrower / Wider (1 to 4 columns) and Taller / Shorter.
- Remove tile.
Each tile shows its source and when it was worked out; Ask this on the latest data opens it as a live answer. Under the title, each source shows worked out …; a tile whose last refresh failed keeps its last figures and says Last refresh failed.
Refresh now works every tile out again at once. Download PDF gives the board as a PDF. The PDF prints English text and ₹; Indian scripts (Devanagari and others) are not in the PDF font yet.
A tile keeps at most 50 table rows, and values of columns marked as
personal data are masked in tiles (A••••••Z, or •••••• for a short
value or one worked out from a personal column), so a board you send as a
PDF does not carry them. Ask this on the latest data shows them in
full.
Studio
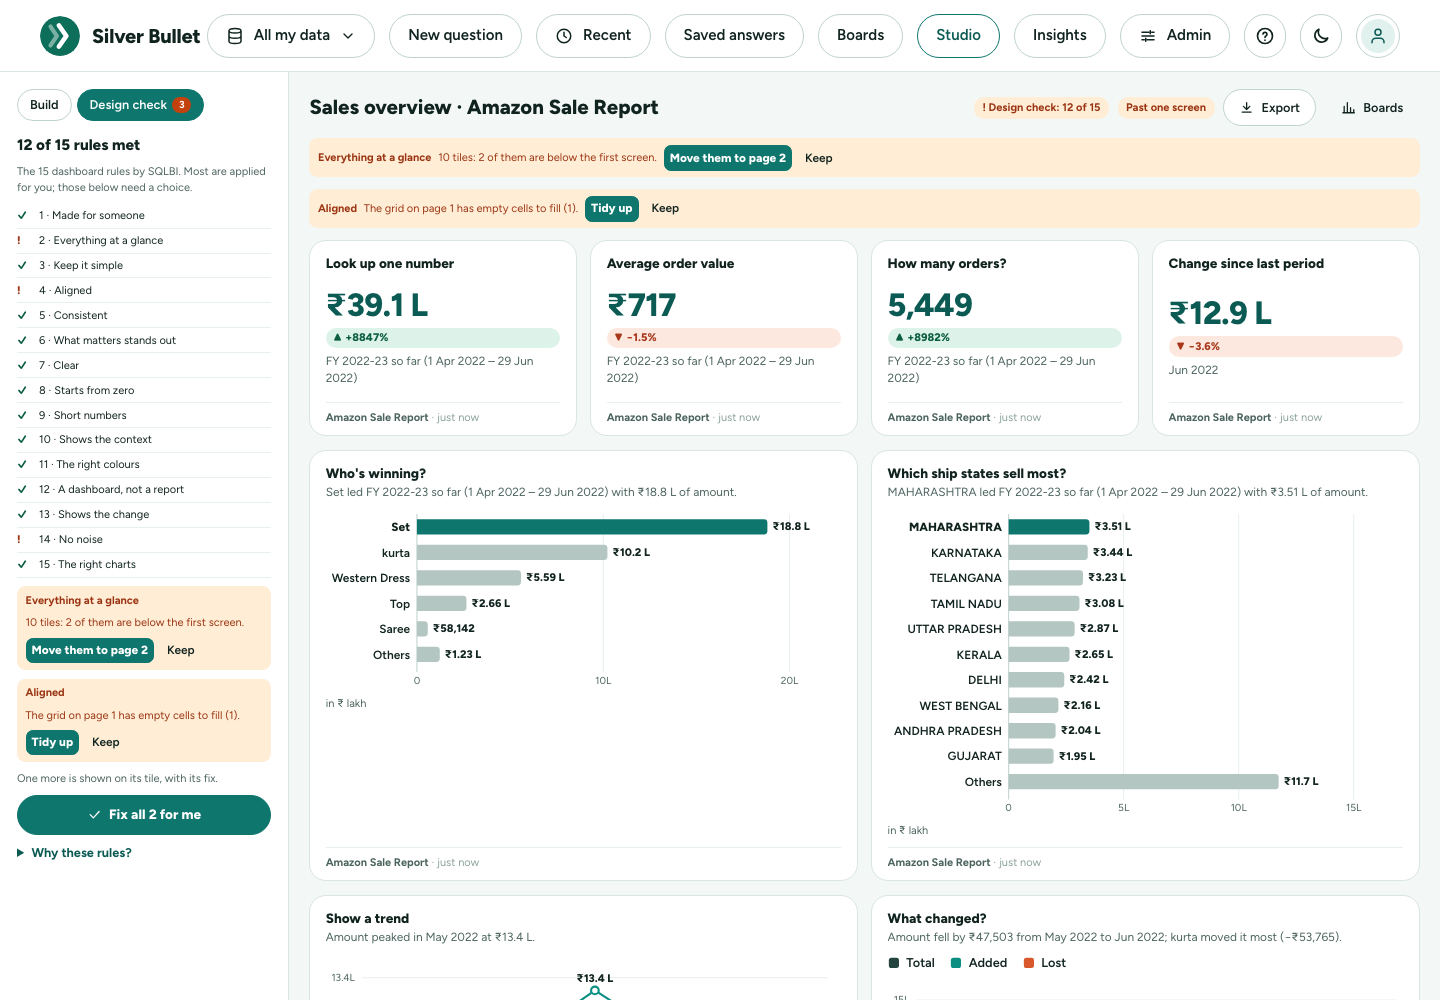
Studio (in the top bar, next to Boards) builds a dashboard with you: the controls on the left, the dashboard on the right. It follows the 15 dashboard rules for you (see Designing a good dashboard below), and tells you when a change breaks one. A Studio dashboard is a board: it is listed under Boards, worked out again on its source’s schedule, and can be downloaded or turned into a brief.
Build it in the chat stays as it is, for one question at a time. While it is open it also offers Build a dashboard in Studio.
Starting
Studio opens with starter dashboards made from your data: Sales overview, Products, Customers, Regions and This month, only those your data can answer, worded with its own names. Pick the data from the Data dropdown (with more than one source it says how many there are; an administrator is also told when some are switched off), and Who is it for? (Business owner, Sales head, Finance or Operations): the audience decides which tiles come first. Open makes the board; Start empty gives a blank one. A blank board has nothing to check yet, so its badge says Design check: add a tile until it has one. In a narrow window the audiences are one row of buttons, with the chosen one’s description under them, so the starters are on the first screen.
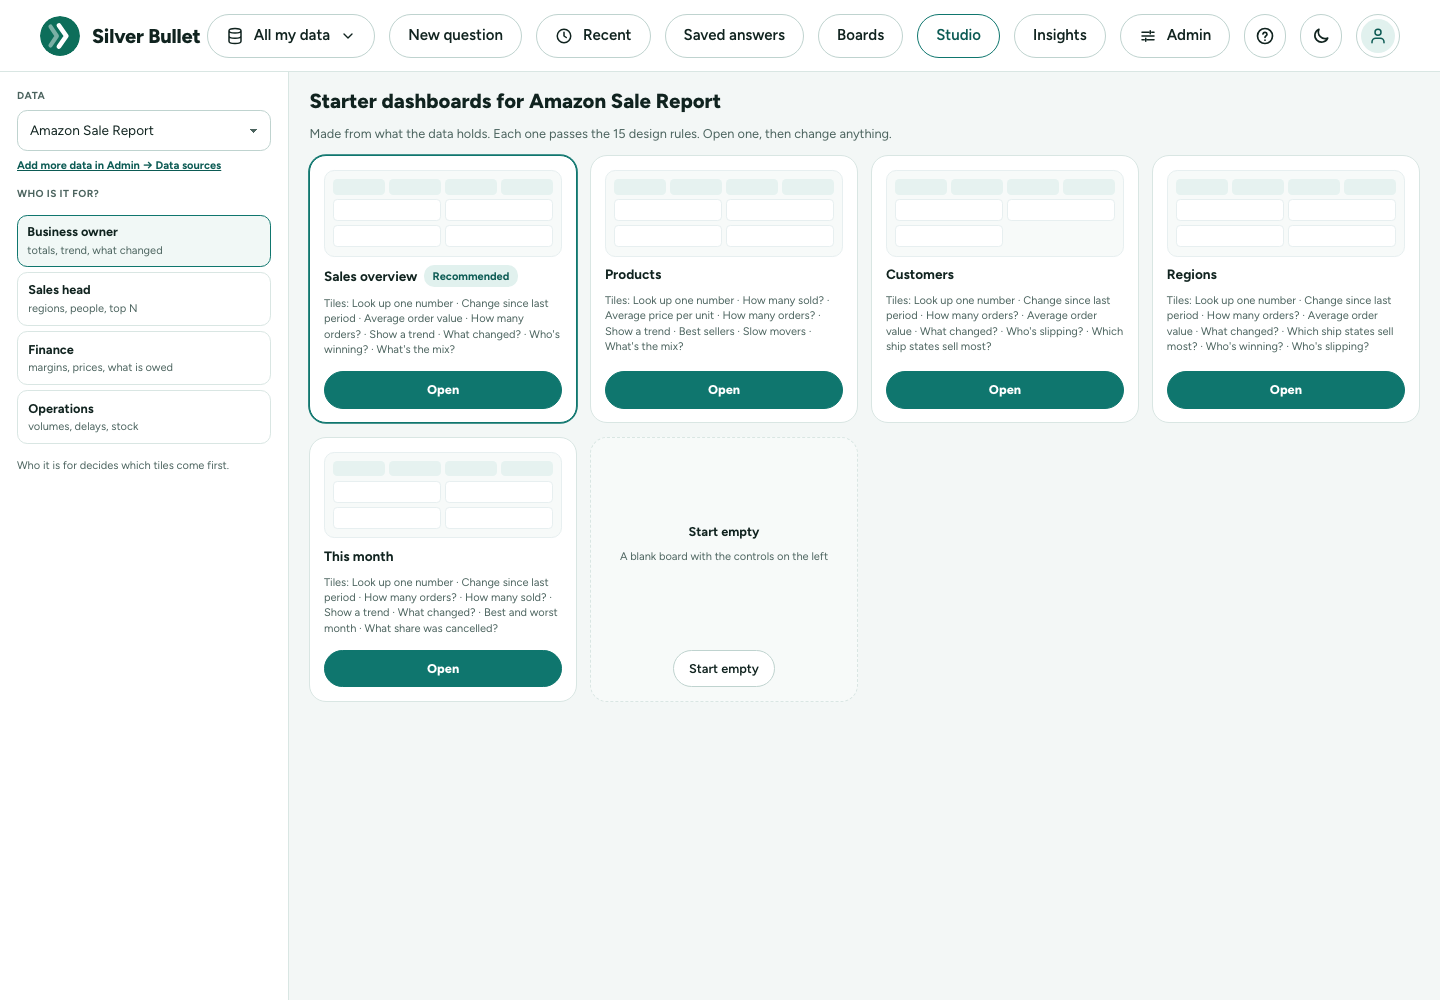
A starter fits one screen (four headline numbers and four charts at most), every number shows its change against the period before, and every tile uses the same period, so it starts at Design check: 15 of 15.
Building a tile
On the left:
- Data: the data new tiles read.
- Fields: its numbers, names and dates. Tap one, or drag it onto the board, to start a tile from it.
- Add a tile: the same verbs as Build it (Total, Average, Count, Top, Bottom, List rows, Share, Trend, Compare).
- Whole board: a Period every tile with dates follows (or Each tile’s own), Compare with (The period before or The same period last year, for the headline numbers), and Who is it for?.
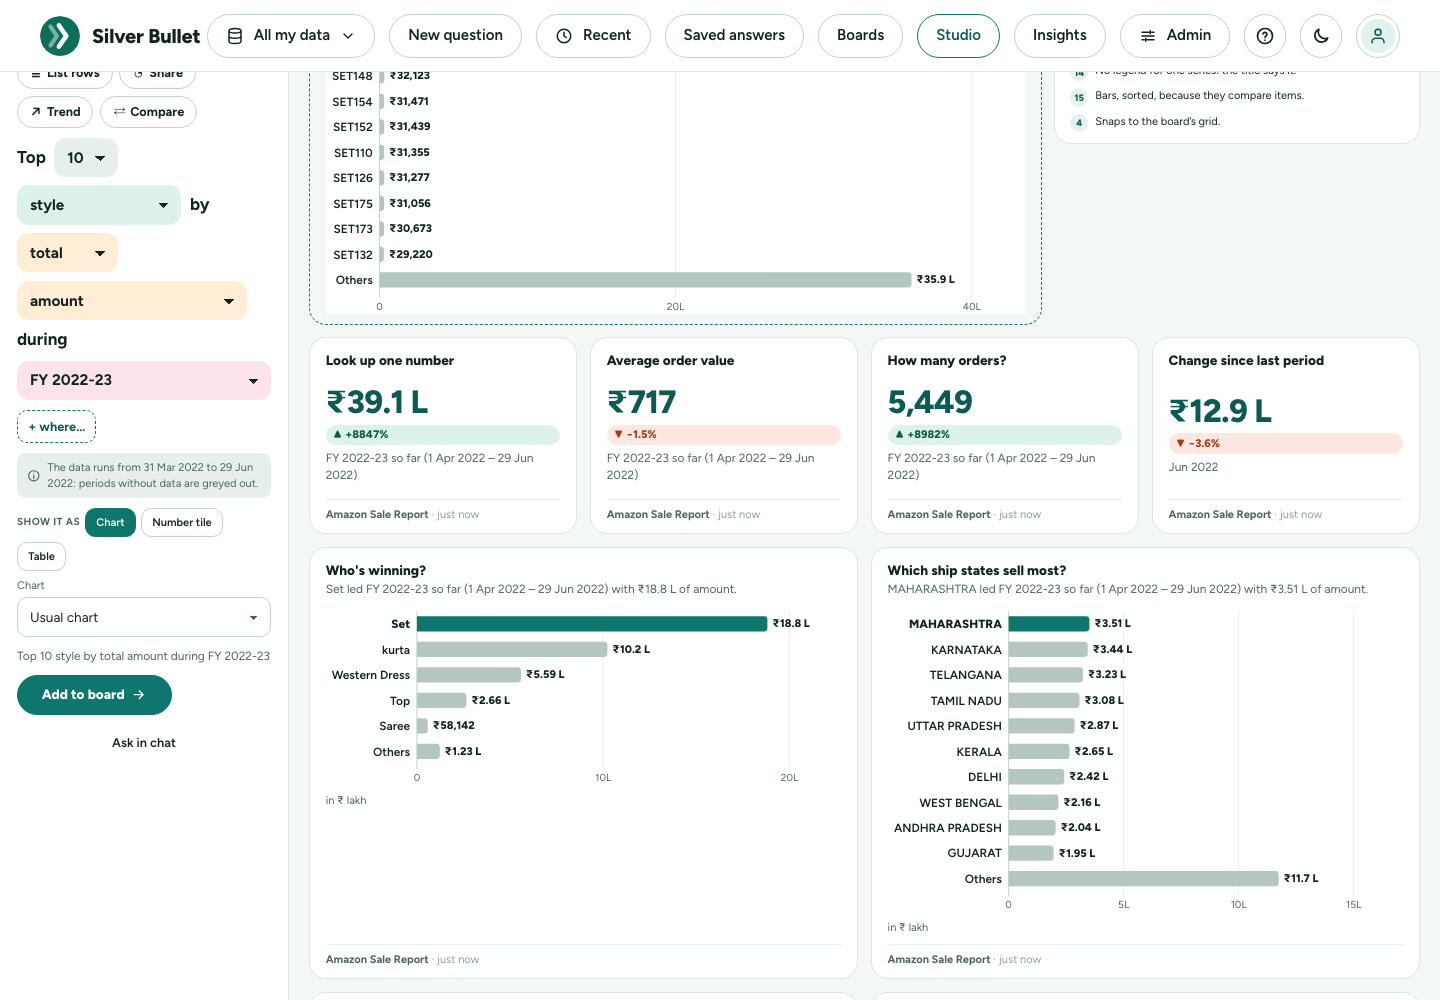
While you pick, the tile shows on the board as a dashed Preview, worked out on your data but not kept, and Done for you lists the rules applied to it in plain words: Bars start at zero, Long figures shortened, The item the headline is about in colour, the rest in grey. Show it as chooses a chart, a number or a table. For a chart, the Chart list offers the same charts as the Chart chip under an answer: Usual chart (the one Silver Bullet picks for the kind of answer, the default), or a bar, line, pie, doughnut, spider, histogram, scatter or bubble chart. The tile keeps the chart you pick, on the board and in its files. When an answer cannot be drawn that way (a doughnut of a trend), the preview says why and keeps its usual chart; when the chart is not the right one for the answer (a line for items that are not in time order), the design check says so and offers sorted bars. Add to board keeps it; Ask in chat asks it as a question instead.
The design check
The badge at the top says how many of the 15 rules the board meets. Design check lists them. A rule the board breaks is shown on the tile (or above the board) with its fix:
| What it says | The fix |
|---|---|
| Tiles below the first screen | Move them to page 2 |
| Empty cells in the grid | Tidy up |
| A pie that is not a share, or has more than 7 slices; a line that is not over time; more than 15 bars | Switch to sorted bars, or Show the top 10 |
| A number without its change | Add the change |
| A table of more than 10 rows | Show the top 5 |
| The same number in another unit or period | Use the same period |
| Nothing compares with another period | Add what changed since last year |
| A title over 60 characters | Shorten the title |
| Two tiles asking the same | Remove the copy |
| Nobody named as the reader | Choose who it is for |
Keep leaves it as it is; Fix all … for me applies every fix. Why these rules? explains each rule in a line.
Export, and a brief
Export gives the dashboard as a PDF, a PowerPoint deck (a slide per tile) or a Word report (a section per page), drawn like the briefs. Make a brief makes an executive brief from it in Insights: each page a page of the brief, each tile a finding asking the same, with the board’s period and filters. You then shape the brief’s words and download it as PDF, PowerPoint or Word. The brief is yours from then on: later changes to the dashboard do not change it.
Opening an answer or a board in Studio
Add to → Open in Studio under an answer starts a dashboard with that answer as its first tile, ready to tune. Open in Studio on a board opens any board you may change in Studio, with its design check.
Designing a good dashboard: the 15 rules
Studio’s design check follows The 15 rules to design a perfect dashboard, published by SQLBI (Alberto Ferrari and Marco Russo, sql.bi/dashboard). They gather what the field has agreed on for years: Stephen Few’s Information Dashboard Design (one screen, read at a glance), Edward Tufte (no decoration, show the context and the change) and the IBCS business-reporting standards (consistent units, short numbers, honest axes). Here they are in our words, with what Silver Bullet does about each.
| # | The rule | What Silver Bullet does |
|---|---|---|
| 1 | Made for someone. Decide who reads it and what they act on. | Who is it for? orders the starters; a board without one is flagged. |
| 2 | Everything at a glance. One screen, read in seconds. | A page holds 12 grid cells (4 × 3); more is flagged, with Move them to page 2. |
| 3 | Keep it simple. No 3D, shadows or decoration. | Charts never have them; a radar chart or more than 6 lines is flagged. |
| 4 | Aligned. One grid, rows filled. | Tiles snap to a 4-column grid; gaps are flagged, with Tidy up. |
| 5 | Consistent. The same number in the same unit and period. | One palette, font and number style on screen and in every file; mismatches are flagged. |
| 6 | What matters stands out. | The headline says it; the bar it is about is in colour and the rest in grey; unusual points on a line are ringed. |
| 7 | Clear. A title, the unit and the period; both axes named. | Every tile has them, and every chart with axes names both: the figure with its unit (Net sales (in ₹ Cr)) and what it is split by (Month, Region). A missing or very long title is flagged. |
| 8 | Start from zero. | Bars always start at zero; a line or waterfall that does not shows a break on its axis. |
| 9 | Short numbers. | ₹4.8 Cr, ₹12.3 L (or $1.2M, 591K), as your region writes them. |
| 10 | Show the context. | Periods compared with the period before or last year; a board with no comparison is flagged. |
| 11 | The right colours. | Up in teal, down in orange (not red and green); the colours are tested for colour-blindness. |
| 12 | A dashboard, not a report. | A table of more than 10 rows is flagged, with Show the top 5. |
| 13 | Show the change. | ▲ / ▼ with the change on numbers; a number without one is flagged. |
| 14 | No noise. | Few axis ticks, labels only where they help, no legend for one series; copies are flagged. |
| 15 | The right charts. | Bars to compare, a line for time, a pie only for parts of a whole (7 slices at most). |
Insights
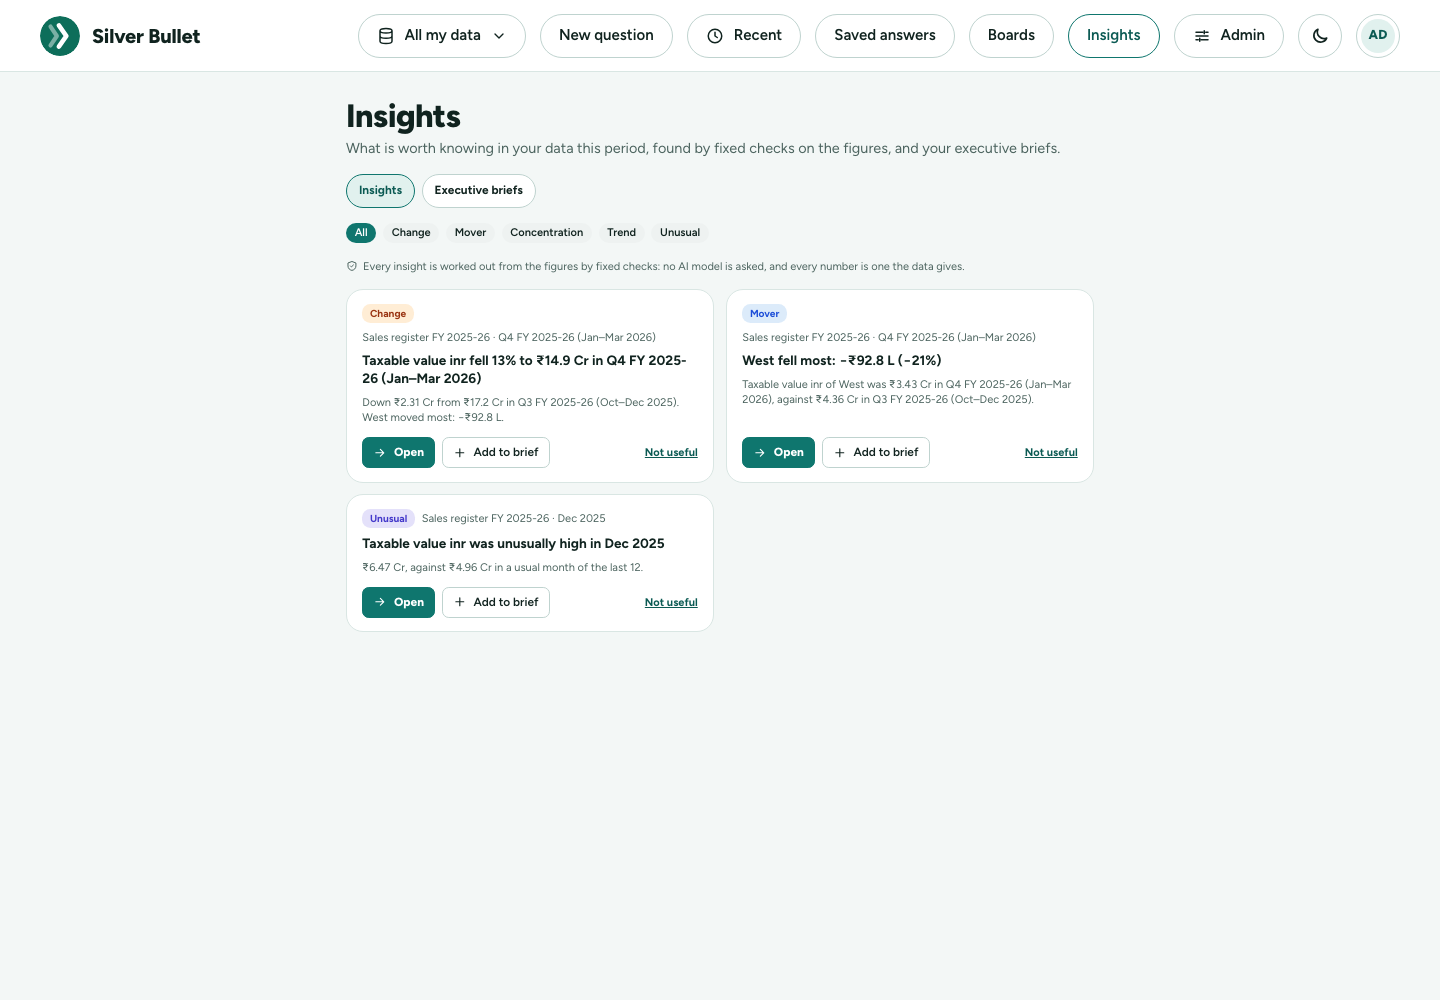
Insights (in the top bar) is what is worth knowing in your data this period, found by fixed checks on each source’s figures, worked out with the brief on each source’s schedule. No AI model is asked, and every number is one the data gives:
- Change: the total moved, and what moved it (a waterfall by region, branch, or the like).
- Mover: what fell most, and what grew fastest.
- Concentration: the top three make up a large share of the total.
- Trend: three or more months in a row up, or down.
- Unusual: a month far from the usual.
Open asks it as a question, with the chart that suits it. Add to brief puts it in an executive brief. Not useful hides it; it comes back if it changes.
Executive briefs
An executive brief is a short document you shape and download as a PDF, a PowerPoint deck or a Word report, to send or present.
- Start one under Insights → Executive briefs → New brief: a Monthly sales review, a Collections review, a Board pack (a page per source) or a Blank brief. Or type Make a brief on September sales in the ask box. A template fills its pages from the insights of the data you choose and works out the figures at once.
- Add any answer with Add to → A brief… under it: it goes in with the chart you chose.
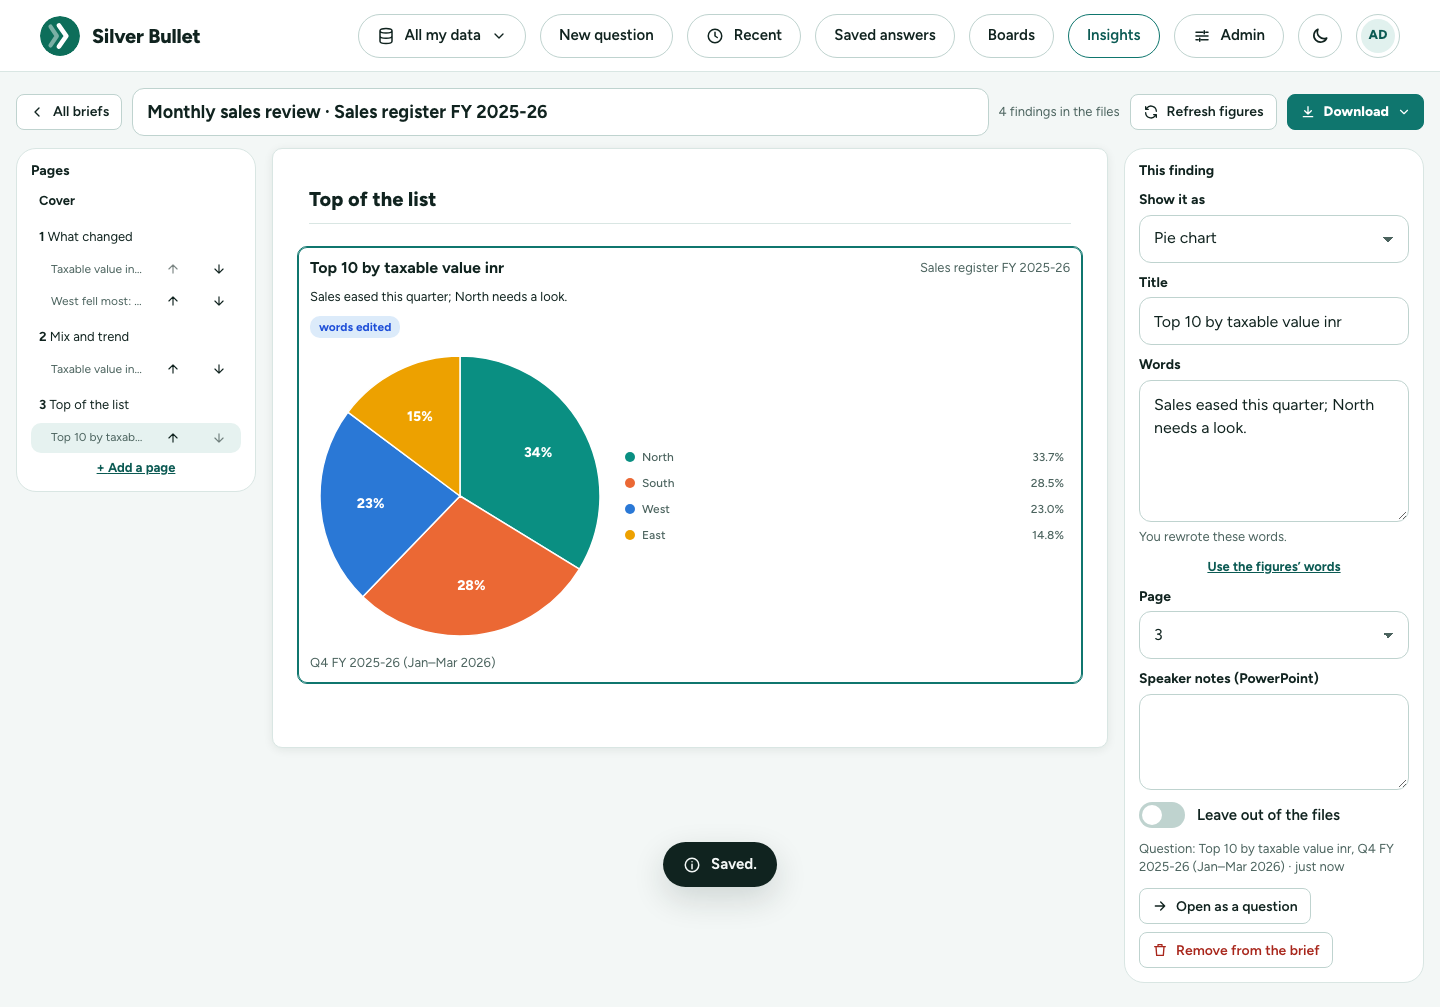
- The editor shows the pages on the left (move a finding up or down, or onto another page; add a page), the page as it prints in the middle, and the chosen finding on the right: Show it as (bar, line, pie, doughnut, spider chart, the number, a table), its title, its words, its page, speaker notes for PowerPoint, and Leave out of the files. The Cover has the title, who it is for, the headline figures and In short.
- The words are written from the figures, never by an AI model, and no figure is sent to one. Rewrite any of them: the finding says words edited, and if the figures change after that it says figures changed and shows what they say now. Use the figures’ words goes back.
- Refresh figures works every finding out again, with values of personal-data columns masked, so a brief you send never carries them.
- Download: PDF (exactly these pages), PowerPoint (one finding per slide, real PowerPoint charts: right-click → Edit data) or Word (real Word charts and tables, styles you can change). Each ends with How this was made: the data, the periods, when the figures were worked out, and a fingerprint of the figures. What you change in PowerPoint or Word stays in that file.
Downloads at a glance
| What | Formats | Where |
|---|---|---|
| An answer’s table | Excel (.xlsx), CSV, or Copy table | Download under the answer |
| An answer’s chart | Picture (.png), or Copy chart | Download under the answer, in chart view |
| A board | Download PDF on the board | |
| An executive brief | PDF, PowerPoint (.pptx), Word (.docx) | the brief editor |
| Your activity | a signed zip | Activity & trust → Records and backups |
Silver Bullet does not send e-mail: you send the file yourself.
Activity & trust
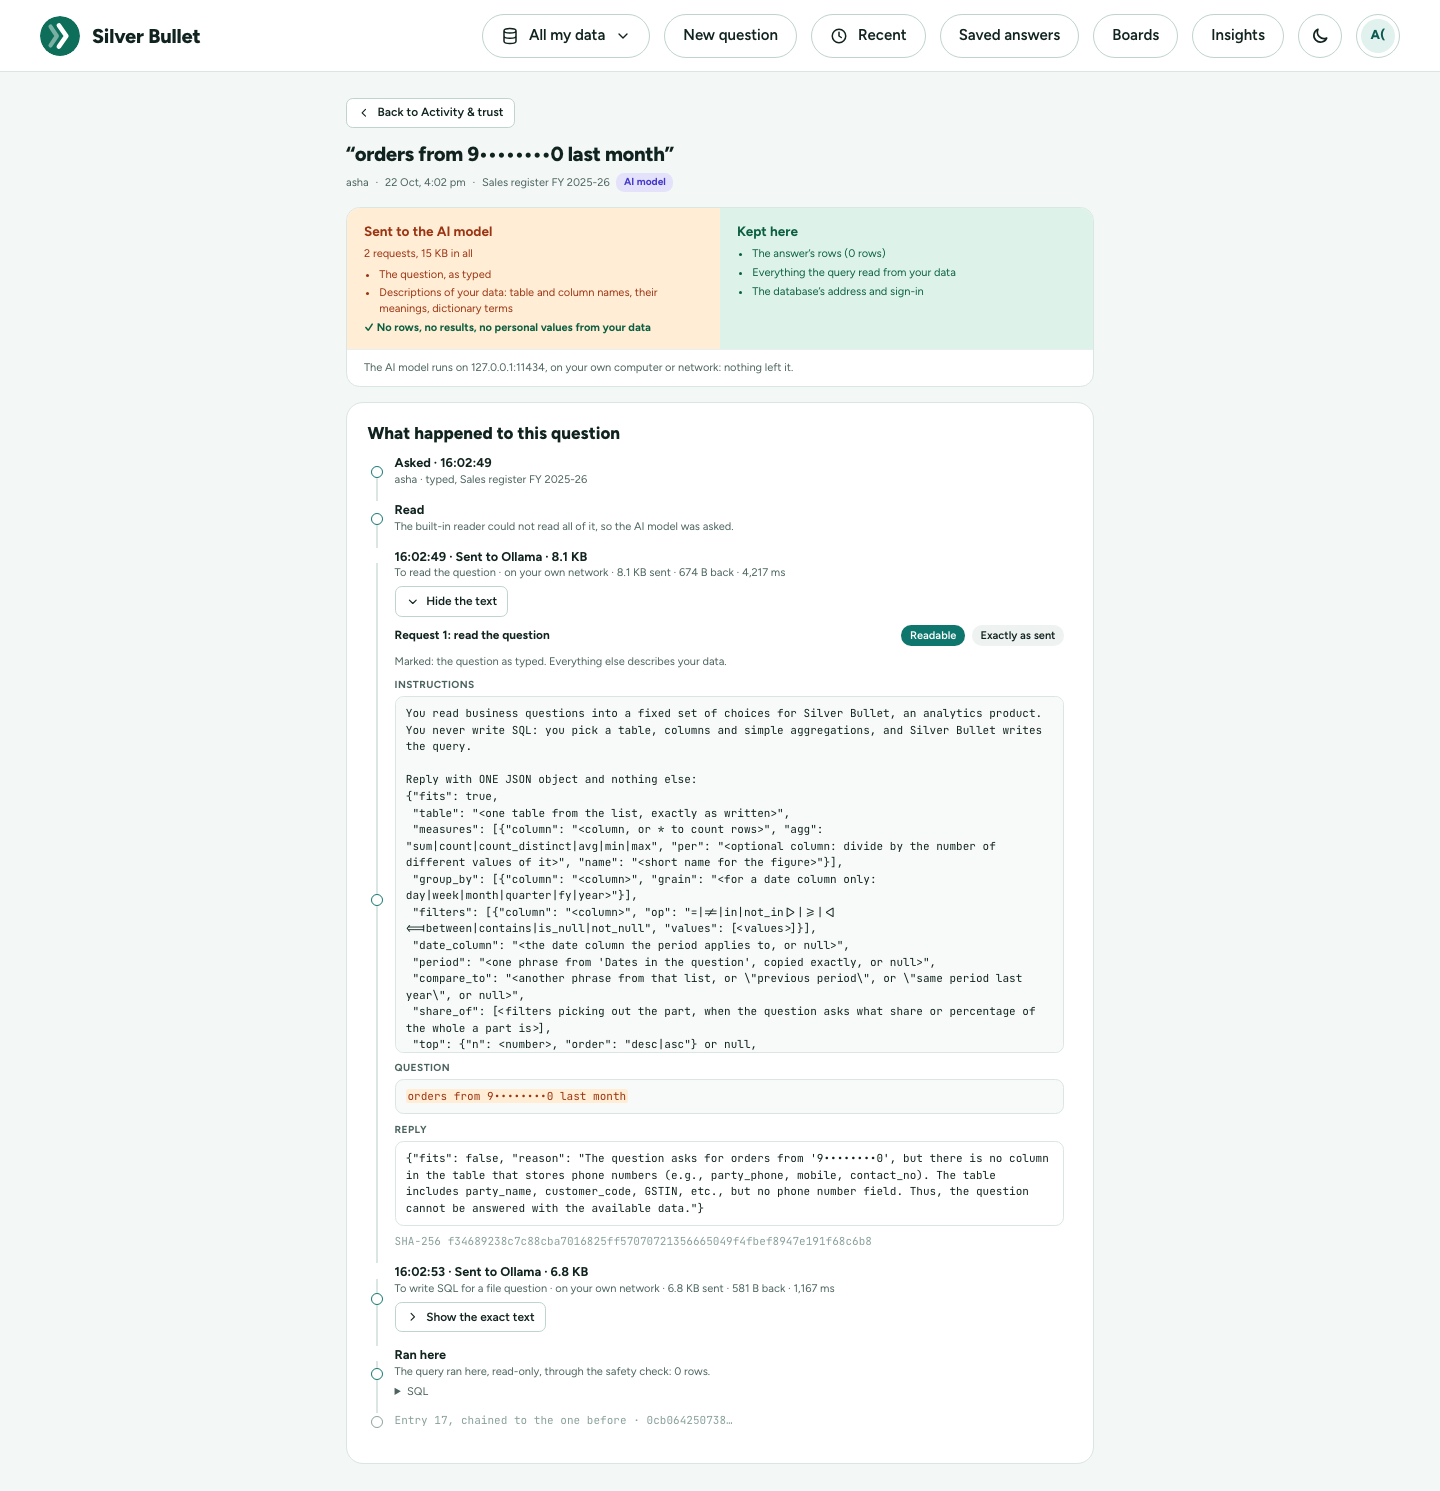
Activity & trust (in your account menu, or Admin → Activity & trust) records every question you ask and every request sent to an AI model, so you can see for yourself what left Silver Bullet. Its tabs:
- My activity: every question, newest first: when, about which data, how it was answered (Verified, Built-in reader, AI model, Not answered), how many rows, and how much was sent. Open one to see What happened to this question: what was read, what was Sent to the AI model beside what was Kept here, the exact text of each request with your question marked, the model’s reply, and its SHA-256 fingerprint. After answering, the text values of the result are looked for in what was sent; the page says what was found (normally none; at most category names the model is shown as examples).
- Overview: over 7 to 365 days, how many questions needed an AI model at all, what the requests carried, where they went (each address, how many requests, how much each way), questions asked often but not yet verified, and what needs a look. Download signed report gives the zip of that period.
- Flags: questions where what you typed looked like a personal value (an e-mail address, phone number, PAN, Aadhaar number, GSTIN or card number) and went to an AI model. They are shown masked; Reveal shows the question as typed. The tip: ask by the customer’s number, or pick the customer with a filter chip, and the value never leaves Silver Bullet.
- Records and backups: whether the record is intact (each entry is chained to the one before, so a change made outside Silver Bullet shows), Download a zip of any period, Check a zip, the monthly backups, and how long things are kept (a year for questions, 90 days for the exact text sent, both adjustable).
Security and Privacy describes the record in detail.
Light and dark
The moon / sun button in the top bar switches between the light and the dark theme. Your choice is remembered in this browser.
In a narrow window
In a narrow window, such as a phone-sized one, the top bar shrinks to icons (data picker, Recent, theme, your account); Saved answers, Boards, Studio, Insights, Admin and Help are in your account menu. Chips and buttons wrap onto more lines, the column chips scroll sideways, and Build it is the sliders button in the ask box.
Indian formats and the financial year
- Money is in ₹, shortened to lakh (L) and crore (Cr) in headlines and charts, and grouped the Indian way in tables (₹1,23,45,678).
- The financial year runs April to March. FY 2025-26 is 1 April 2025 to 31 March 2026. Quarters are financial quarters: Q1 FY 2025-26 is April to June 2025, Q4 is January to March 2026.
- “Last year” is read as the last financial year, and the period chip says so; tap it to use the calendar year instead. This FY, last FY, this FY so far, YTD, last quarter, last 3 months, same period last year and dates such as 1 Apr 2025 to 30 Jun 2025 are all understood.
- The interface is in English only.
April is the default start of the financial year; Silver Bullet can be set to another month.
What Silver Bullet will not do
- Change data. A question that asks to delete, update, add or change anything is refused (The question asks to change data; Silver Bullet only reads it.). Ask what you want to know instead: “how many orders were cancelled?”.
- Answer what the data does not hold. If nothing in the data fits, it says This data cannot answer that question. Try the cards on the home page, or ask about what the data holds. If nothing matched your filters, the headline says No data for …: try another period or fewer filters.
- Combine two data sources in one question (not in this release).
- Send your rows to the AI model. Rows, results and values of personal-data columns are never sent; Activity & trust shows what was.
Asking well
- Name the figure. “Top 10 customers by net sales”, not “best customers”.
- Name the period. Without one the question covers all dates, or the usual period set in your data dictionary. “Net sales last quarter”.
- One thing at a time. A ranking and its monthly detail are two questions: ask the ranking, then tap Ask next or a chip.
- Use your data’s words. The column chips and type-ahead show what the data calls things; values such as region names must match (“North”).
- Prefer a tap. A card, a chip or Build it never waits for the AI model.
- Check the chips. If a chip is not what you meant, tap it and change it before you use the figure.
- Correct what is wrong. No, fix it takes three taps, and once you check it under Your corrections the next answer is right.
When something goes wrong
Messages say what happened and what to do. Many carry a code (SB3-…) and a Reference: note both with the time; they point to the exact event in the log (Admin → Health and logs). The Troubleshooting Guide lists every code. If an answer looks wrong, use No, fix it.
Support: ______________________